
Overview
This strategy is an advanced quantitative trading system that combines moving averages with a dynamic range filter. It identifies market trends by analyzing the relationship between price movements and trading volume, while using a range filter to eliminate false signals and improve trading accuracy. The strategy employs adaptive calculation methods to determine market liquidity boundaries and combines fast and slow moving averages to confirm trend directions.
Strategy Principles
The core logic of the strategy is based on the following key calculations:
- Liquidity Analysis: Evaluates market liquidity by calculating the ratio of volume to price movement and sets dynamic liquidity boundaries.
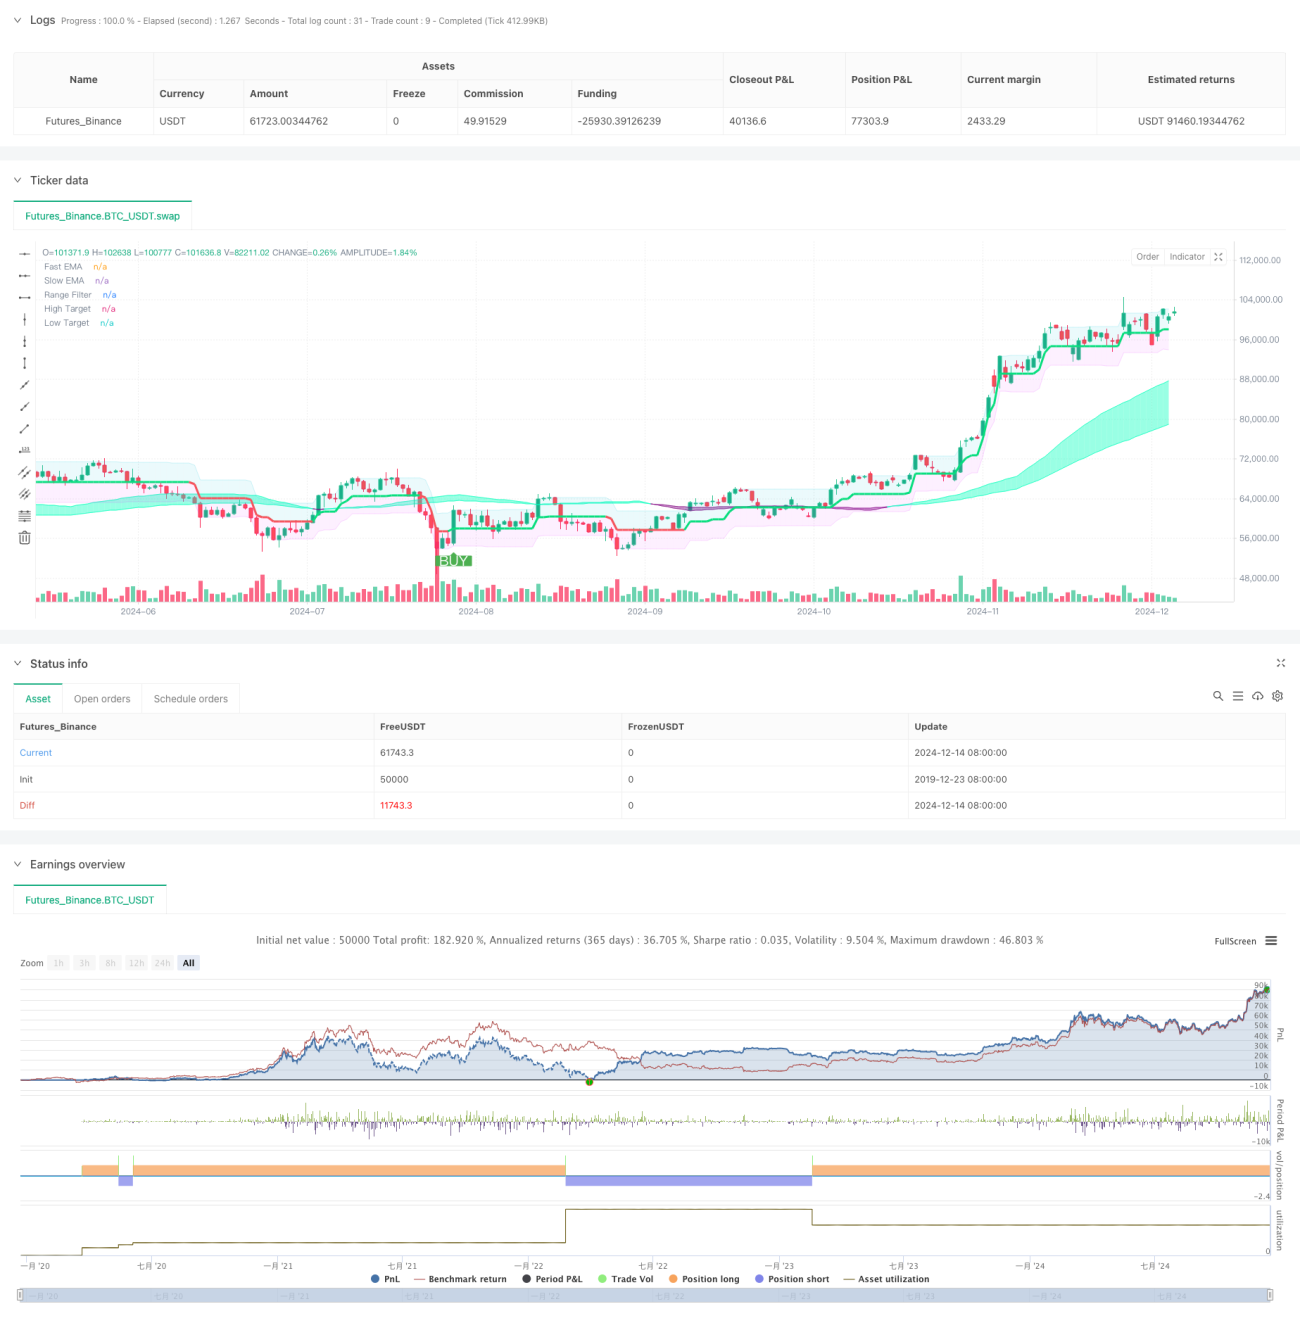
- Trend Confirmation: Uses 50-period and 100-period Exponential Moving Averages (EMA) to confirm trend direction.
- Range Filtering: Employs a 50-period sampling period and 3x range multiplier to construct dynamic trading ranges.
- Signal Generation: Generates trading signals when price breaks through the range filter and EMA indicators show consistent trends.
Strategy Advantages
- Strong Adaptability: The strategy can dynamically adjust parameters based on market conditions, adapting to different market environments.
- Reliable Signals: Effectively reduces false signals by combining multiple technical indicators and filters.
- Comprehensive Risk Management: Integrates automatic calculation of stop-loss positions for effective risk control.
- Complete Backtesting Functionality: Includes detailed backtesting settings for strategy optimization.
Strategy Risks
- Parameter Sensitivity: Multiple parameters require fine-tuning and are prone to over-optimization.
- Slippage Impact: May face significant slippage risk in highly volatile markets.
- Market Adaptability: May generate frequent false signals in ranging markets.
- Capital Management: Fixed capital allocation method may not suit all market conditions.
Strategy Optimization Directions
- Parameter Adaptation: Introduce adaptive parameter adjustment mechanisms for automatic parameter tuning based on market conditions.
- Market State Recognition: Add market state identification modules to apply different trading strategies under different market conditions.
- Capital Management Optimization: Implement dynamic position sizing based on market volatility.
- Signal Filter Enhancement: Add more technical indicators to filter out false signals.
Summary
The strategy constructs a complete quantitative trading system by combining liquidity analysis, trend following, and range filtering. Its strengths lie in its ability to adapt to market changes and provide reliable trading signals, while requiring attention to parameter optimization and risk management. Through continuous optimization and improvement, the strategy shows promise in maintaining stable performance across different market environments.
- 1