High-Frequency Price-Volume Trend Following with Volume Analysis Adaptive Strategy

Overview
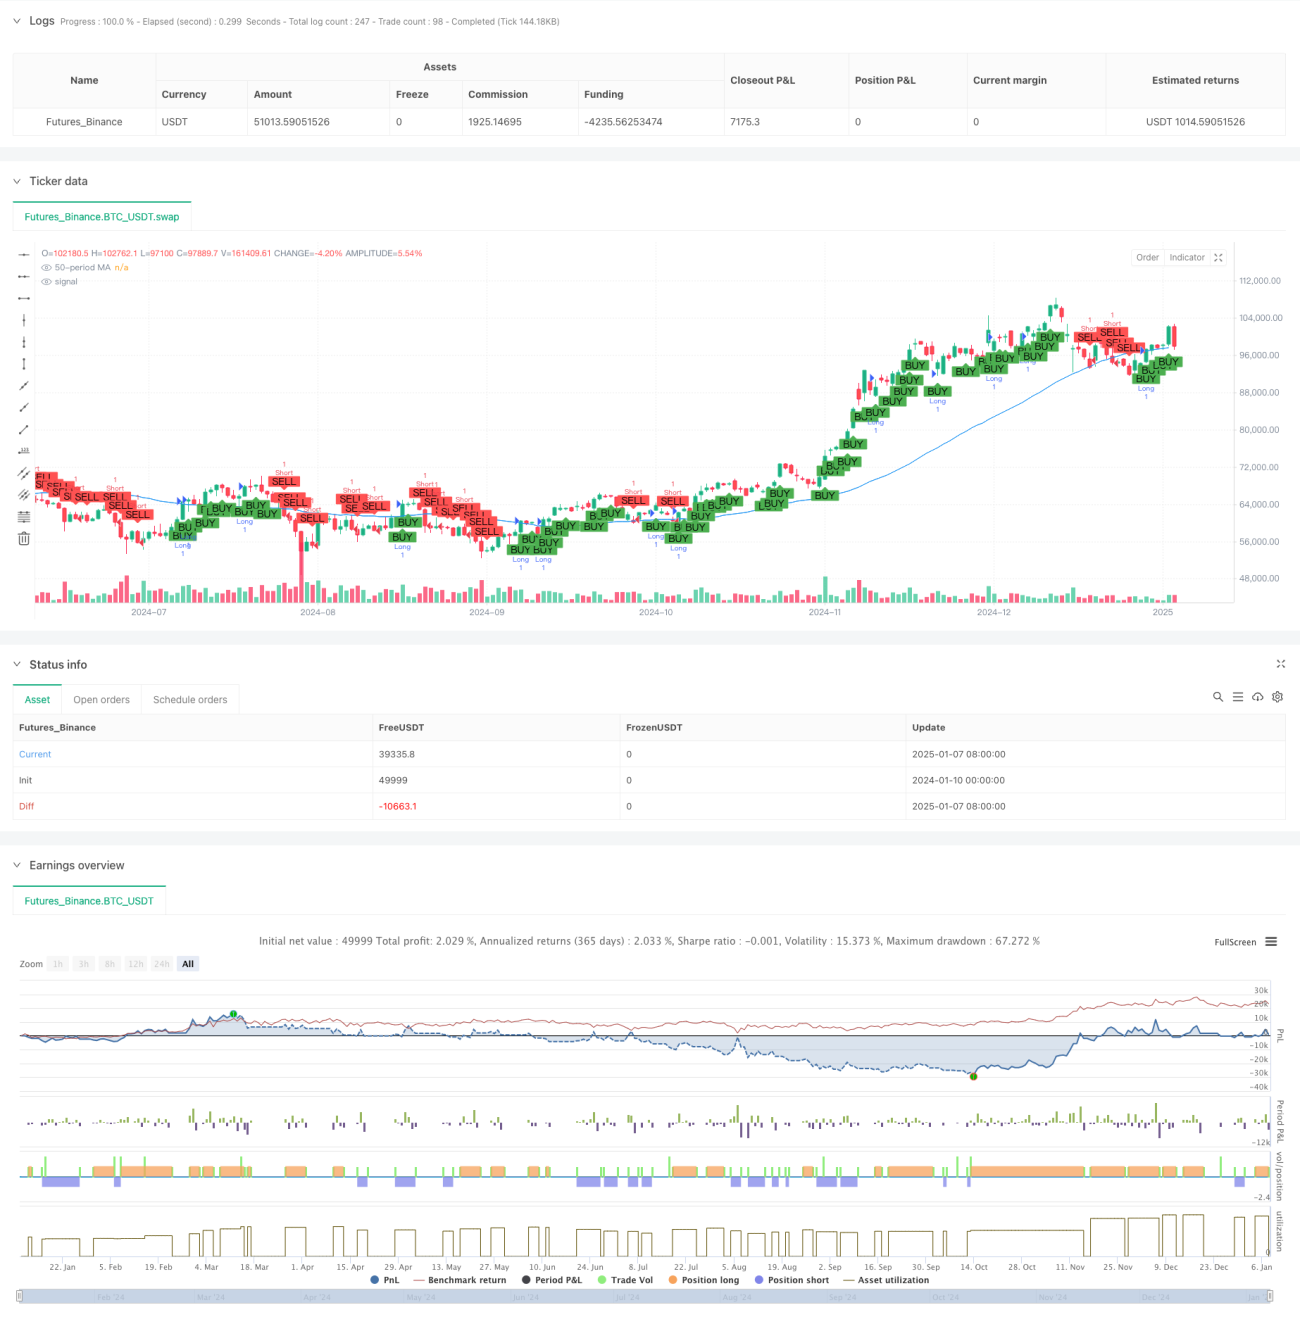
This strategy is an automated trading system based on a 5-minute timeframe, combining moving average trend following and volume analysis methods. The strategy uses a 50-period Simple Moving Average (SMA) to determine market trends while incorporating volume analysis to validate trading signals. The system implements fixed stop-loss and take-profit targets for fully automated trading.
Strategy Principles
The core logic includes the following key components:
- Trend Identification: Uses 50-period SMA to determine market direction, considering uptrend when close is above MA and downtrend when below. Also confirms trends using price movement over the last 30 minutes (6 candles).
- Volume Analysis: Calculates buy and sell volumes based on price movement, distributing volume within each candle according to closing price position.
- Signal Generation: Generates long signals when buy volume exceeds sell volume in uptrends; generates short signals when sell volume exceeds buy volume in downtrends.
- Risk Management: Implements 3% stop-loss and 29% take-profit targets to manage risk-reward ratio for each trade.
Strategy Advantages
- Multi-dimensional Trend Confirmation: Combines moving average and short-term price movement for improved trend accuracy.
- Volume Validation: Incorporates volume analysis as a signal filter to avoid false breakouts in low-volume environments.
- Comprehensive Risk Management: Sets clear stop-loss and take-profit targets for effective trade risk control.
- Strong Adaptability: Strategy automatically adjusts trading direction based on market conditions.
Strategy Risks
- Choppy Market Risk: May generate frequent false breakout signals in range-bound markets, leading to consecutive losses.
- Slippage Risk: High-frequency trading may face significant slippage, affecting execution quality.
- Parameter Sensitivity: Strategy performance is sensitive to moving average period and volume calculation period parameters.
- Market Environment Dependency: Performs well in trending markets but may experience drawdowns during trend transitions.
Strategy Optimization Directions
- Dynamic Parameter Optimization: Introduce adaptive parameter mechanisms to adjust MA and volume calculation periods based on market volatility.
- Market Environment Filtering: Add volatility or trend strength indicators to automatically stop trading in unsuitable market conditions.
- Improved Stop-Loss Mechanism: Implement dynamic stop-loss, such as trailing stops or ATR-based stops, for more flexible risk control.
- Enhanced Signal Generation: Consider incorporating additional technical indicators for cross-validation to improve signal reliability.
Summary
This strategy combines trend following and volume analysis to create a comprehensive high-frequency trading system. Its main strengths lie in multi-dimensional signal confirmation and robust risk control. While inherent risks exist, the proposed optimization directions can further enhance strategy stability and adaptability. The strategy is particularly suitable for trending market environments and can achieve stable trading results through proper parameter optimization and risk management.
/*backtest
start: 2024-01-10 00:00:00
end: 2025-01-08 08:00:00
period: 1d
basePeriod: 1d
exchanges: [{"eid":"Futures_Binance","currency":"BTC_USDT","balance":49999}]
*/

// This Pine Script™ code is subject to the terms of the Mozilla Public License 2.0 at https://mozilla.org/MPL/2.0/
// © Jerryorange

//@version=6- 1