Multi-Period Phase Crossover with EMA Trend Following Strategy

Overview
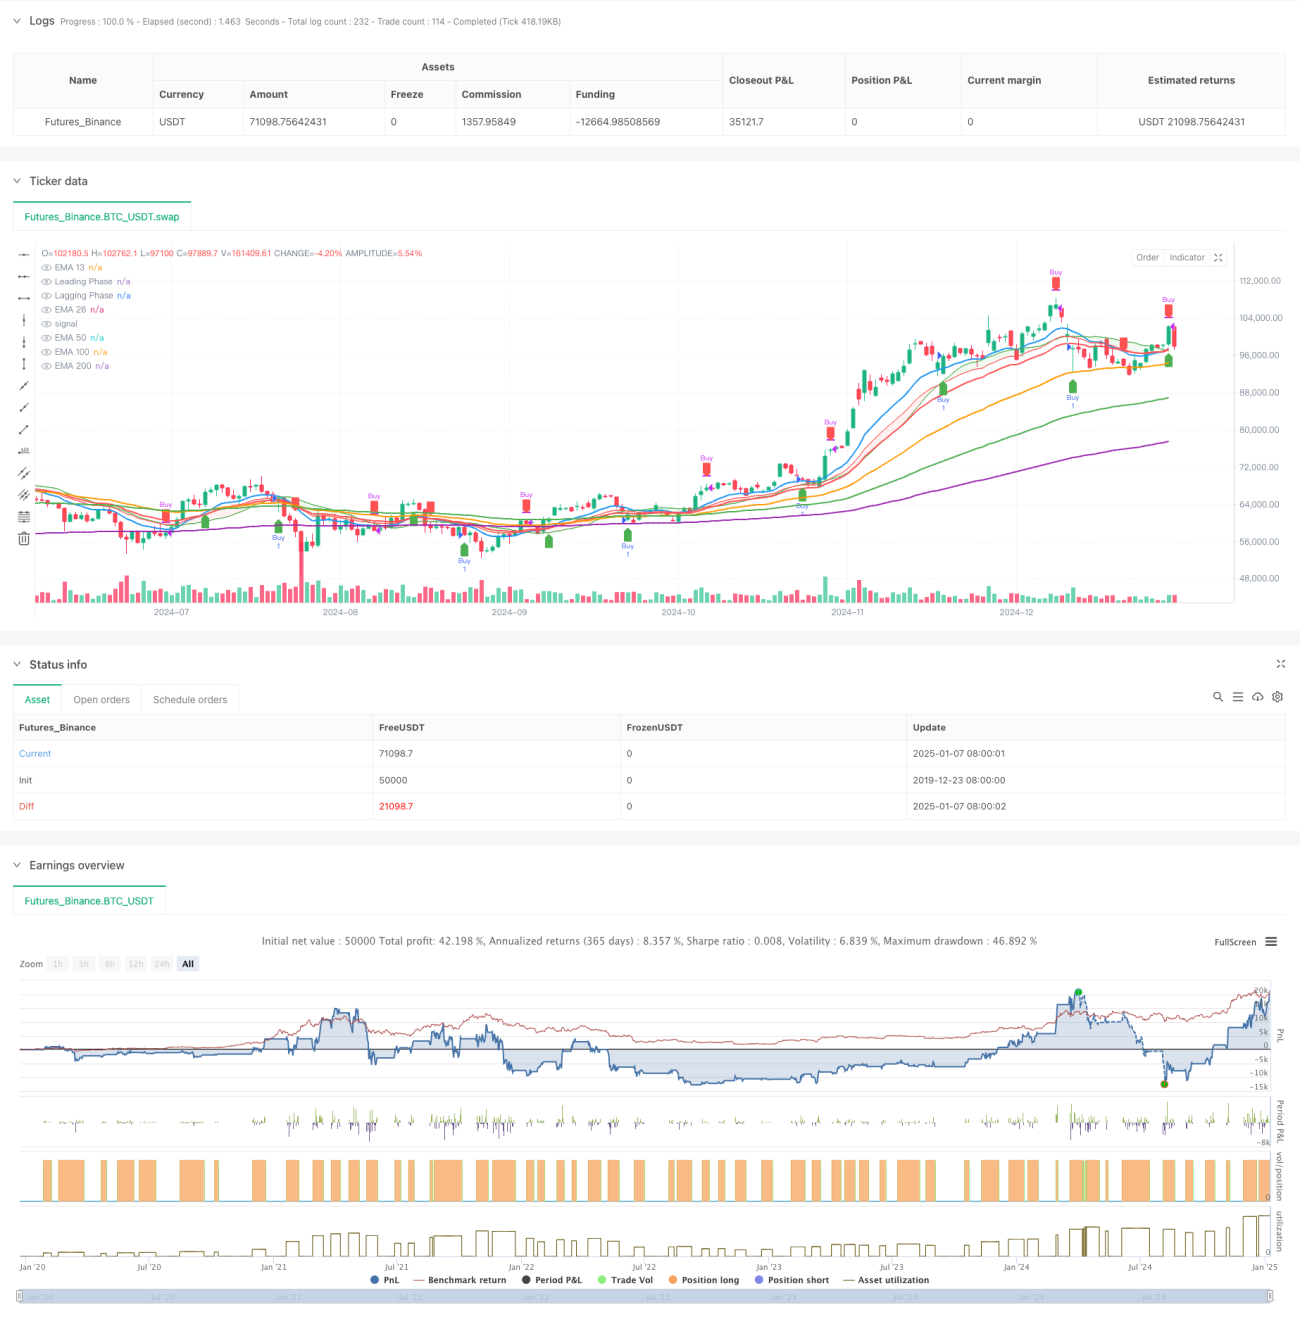
This strategy combines phase crossover signals with multi-period exponential moving averages to capture market buying and selling opportunities. It utilizes the crossover of Leading Phase and Lagging Phase to generate trading signals, while incorporating 13, 26, 50, 100, and 200-period EMAs for trend confirmation, providing a comprehensive solution for trend following and short-term trading.
Strategy Principles
The core logic consists of two main components: the Phase Crossover System and the EMA Trend Confirmation System. The Phase Crossover System uses a Simple Moving Average (SMA) with upward offset as the Leading Phase and an Exponential Moving Average (EMA) with downward offset as the Lagging Phase. Buy signals are generated when the Leading Phase crosses above the Lagging Phase, and sell signals when it crosses below. The EMA Trend Confirmation System uses multiple period (13/26/50/100/200) exponential moving averages to confirm overall market trends, with the 13 and 26-period EMA crossovers serving as secondary trading signals.
Strategy Advantages
- Complete Signal System: Combines short-term phase crossover signals with long-term trend confirmation to effectively filter false signals
- Strong Trend Following Capability: Accurately captures main trend directions through multi-period EMA system
- Good Visualization: Uses colored zones to identify bullish and bearish conditions with clear trading signals
- Strong Parameter Adaptability: Can be adjusted for different market characteristics and trading periods
- Reasonable Risk Control: Combines multiple indicators for confirmation to effectively control trading risks
Strategy Risks
- Oscillation Market Risk: May generate excessive trading signals during consolidation phases, increasing trading costs
- Lag Risk: Moving averages inherently have lag, potentially missing optimal entry points
- False Breakout Risk: May generate false breakout signals during high market volatility
- Parameter Sensitivity: Different parameter settings may lead to significant strategy performance variations
- Market Environment Dependency: Strategy performs better in trending markets but underperforms in oscillating markets
Strategy Optimization Directions
- Add volatility filters to reduce trading frequency during low volatility periods
- Include volume confirmation indicators to improve signal reliability
- Optimize stop-loss and take-profit mechanisms, establish dynamic stop-loss system
- Introduce market environment classification to adjust strategy parameters for different market states
- Develop adaptive parameter system for dynamic strategy optimization
Summary
This strategy builds a comprehensive trend following trading system by combining phase crossover and multi-period EMA systems. It features clear signals, accurate trend capture, and reasonable risk control, while also having certain lag and false signal risks. The strategy's stability and reliability can be further enhanced through optimizations such as adding volatility filters and volume confirmation. It is suitable for application in clearly trending markets, and traders need to adjust parameters based on specific market characteristics and individual risk preferences.
- 1