概述
本策略是一个基于RSI和随机RSI双重动量指标的智能交易系统。该策略通过结合两个动量振荡器的信号来识别市场超买和超卖状态,从而捕捉潜在的交易机会。系统支持周期自适应,可以根据不同的市场环境灵活调整交易周期。
策略原理
策略核心逻辑基于以下几个关键要素: 1. 使用14周期的RSI指标计算价格动量 2. 采用14周期的随机RSI进行二次确认 3. 当RSI低于35且随机RSI低于20时,触发买入信号 4. 当RSI高于70且随机RSI高于80时,触发卖出信号 5. 通过SMA对随机RSI进行3周期平滑处理,提高信号稳定性 6. 支持在日线和周线周期之间自由切换
策略优势
- 双重信号确认机制大幅降低了虚假信号的干扰
- 指标参数可根据市场波动灵活调整,适应性强
- 采用SMA平滑处理,有效降低了信号噪音
- 支持多周期交易,可以满足不同投资者的需求
- 可视化界面直观展示买卖信号,便于分析决策
- 代码结构清晰,易于维护和二次开发
策略风险
- 在横盘震荡市场可能产生过多交易信号
- 急速趋势转折时可能出现信号滞后
- 参数设置不当可能导致错失交易机会
- 市场高波动期可能出现虚假信号
- 需要合理设置止损以控制风险
策略优化方向
- 引入趋势判断指标,如MACD或EMA,提高信号可靠性
- 增加成交量因子,提升信号质量
- 添加动态止损机制,优化风险管理
- 开发自适应参数优化系统,提高策略稳定性
- 考虑引入市场波动率指标,优化交易时机
总结
该策略通过结合RSI和随机RSI的优势,构建了一个可靠的交易系统。双重信号确认机制有效降低了虚假信号,而灵活的参数设置则提供了较强的适应性。通过不断优化和完善,该策略有望在各种市场环境下都能保持稳定的表现。
策略源码
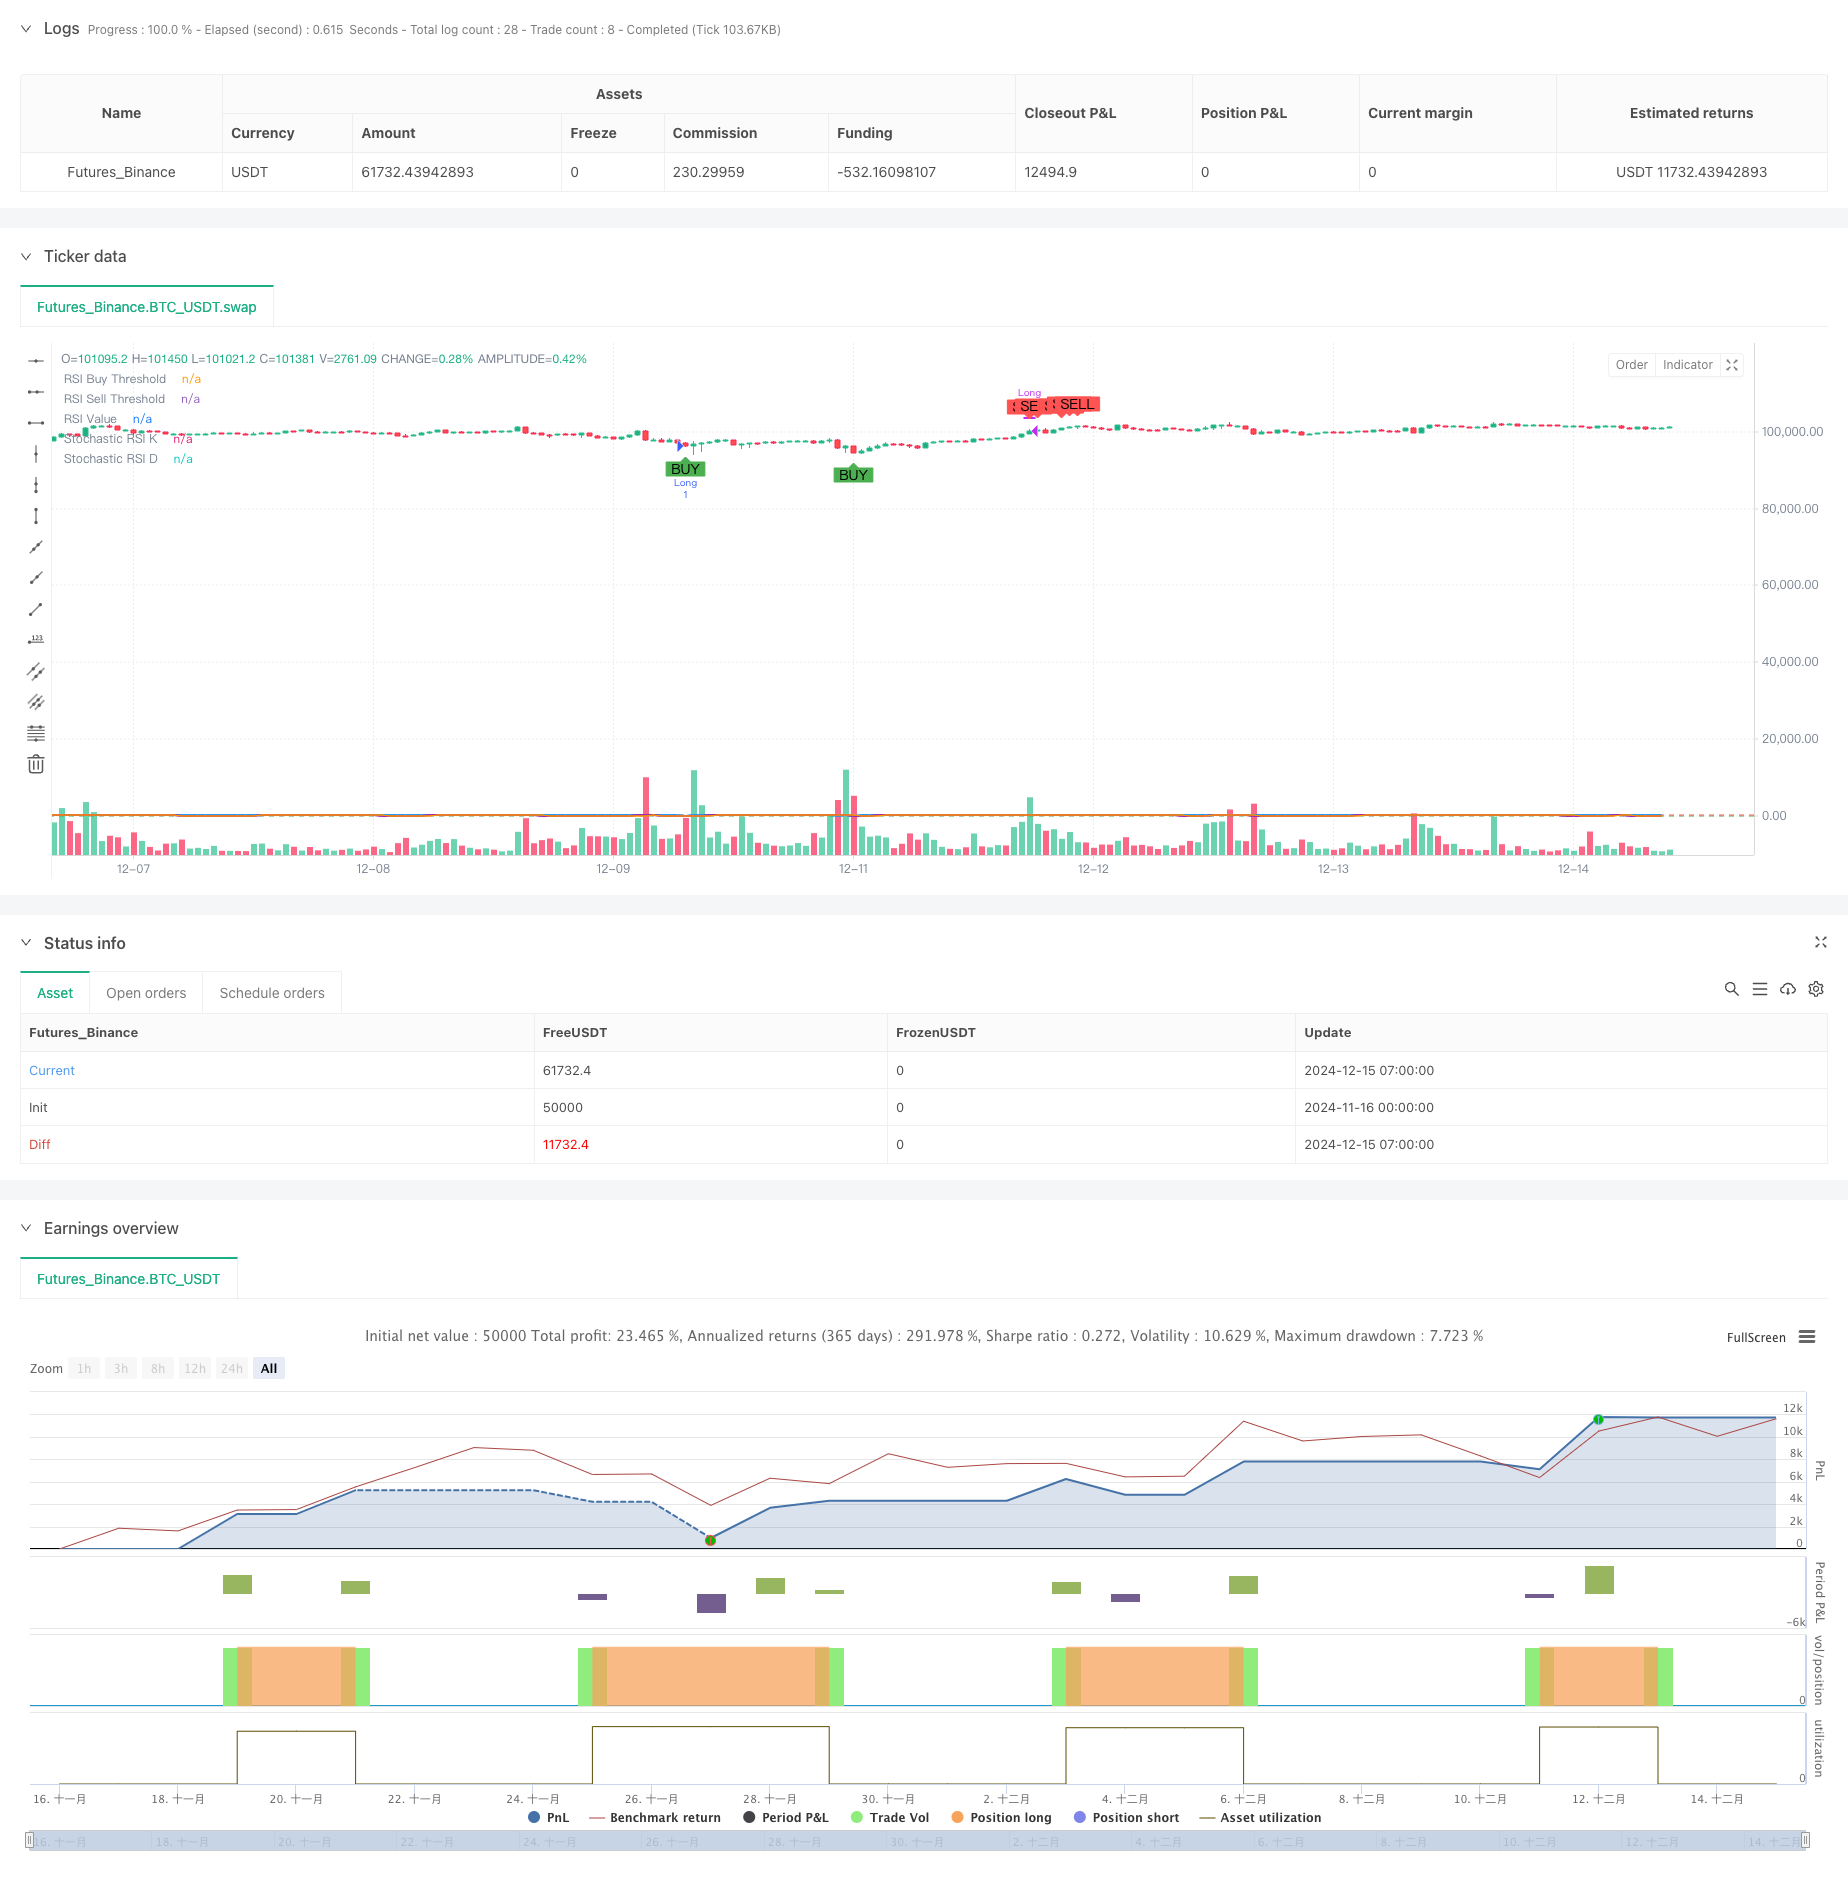
/*backtest
start: 2024-11-16 00:00:00
end: 2024-12-15 08:00:00
period: 1h
basePeriod: 1h
exchanges: [{"eid":"Futures_Binance","currency":"BTC_USDT"}]
*/

//@version=5
strategy("BTC Buy & Sell Strategy (RSI & Stoch RSI)", overlay=true)

// Input Parameters
rsi_length = input.int(14, title="RSI Length")
stoch_length = input.int(14, title="Stochastic Length")
stoch_smooth_k = input.int(3, title="Stochastic %K Smoothing")
stoch_smooth_d = input.int(3, title="Stochastic %D Smoothing")

// Threshold Inputs
rsi_buy_threshold = input.float(35, title="RSI Buy Threshold")
stoch_buy_threshold = input.float(20, title="Stochastic RSI Buy Threshold")
rsi_sell_threshold = input.float(70, title="RSI Sell Threshold")
stoch_sell_threshold = input.float(80, title="Stochastic RSI Sell Threshold")

use_weekly_data = input.bool(false, title="Use Weekly Data", tooltip="Enable to use weekly timeframe for calculations.")

// Timeframe Configuration
timeframe = use_weekly_data ? "W" : timeframe.period

// Calculate RSI and Stochastic RSI
rsi_value = request.security(syminfo.tickerid, timeframe, ta.rsi(close, rsi_length))
stoch_rsi_k_raw = request.security(syminfo.tickerid, timeframe, ta.stoch(close, high, low, stoch_length))
stoch_rsi_k = ta.sma(stoch_rsi_k_raw, stoch_smooth_k)
stoch_rsi_d = ta.sma(stoch_rsi_k, stoch_smooth_d)

// Define Buy and Sell Conditions
buy_signal = (rsi_value < rsi_buy_threshold) and (stoch_rsi_k < stoch_buy_threshold)
sell_signal = (rsi_value > rsi_sell_threshold) and (stoch_rsi_k > stoch_sell_threshold)

// Strategy Execution
if buy_signal
    strategy.entry("Long", strategy.long, comment="Buy Signal")

if sell_signal
    strategy.close("Long", comment="Sell Signal")

// Plot Buy and Sell Signals
plotshape(buy_signal, style=shape.labelup, location=location.belowbar, color=color.green, title="Buy Signal", size=size.small, text="BUY")
plotshape(sell_signal, style=shape.labeldown, location=location.abovebar, color=color.red, title="Sell Signal", size=size.small, text="SELL")

// Plot RSI and Stochastic RSI for Visualization
hline(rsi_buy_threshold, "RSI Buy Threshold", color=color.green)
hline(rsi_sell_threshold, "RSI Sell Threshold", color=color.red)

plot(rsi_value, color=color.blue, linewidth=2, title="RSI Value")
plot(stoch_rsi_k, color=color.purple, linewidth=2, title="Stochastic RSI K")
plot(stoch_rsi_d, color=color.orange, linewidth=1, title="Stochastic RSI D")
相关推荐