概述
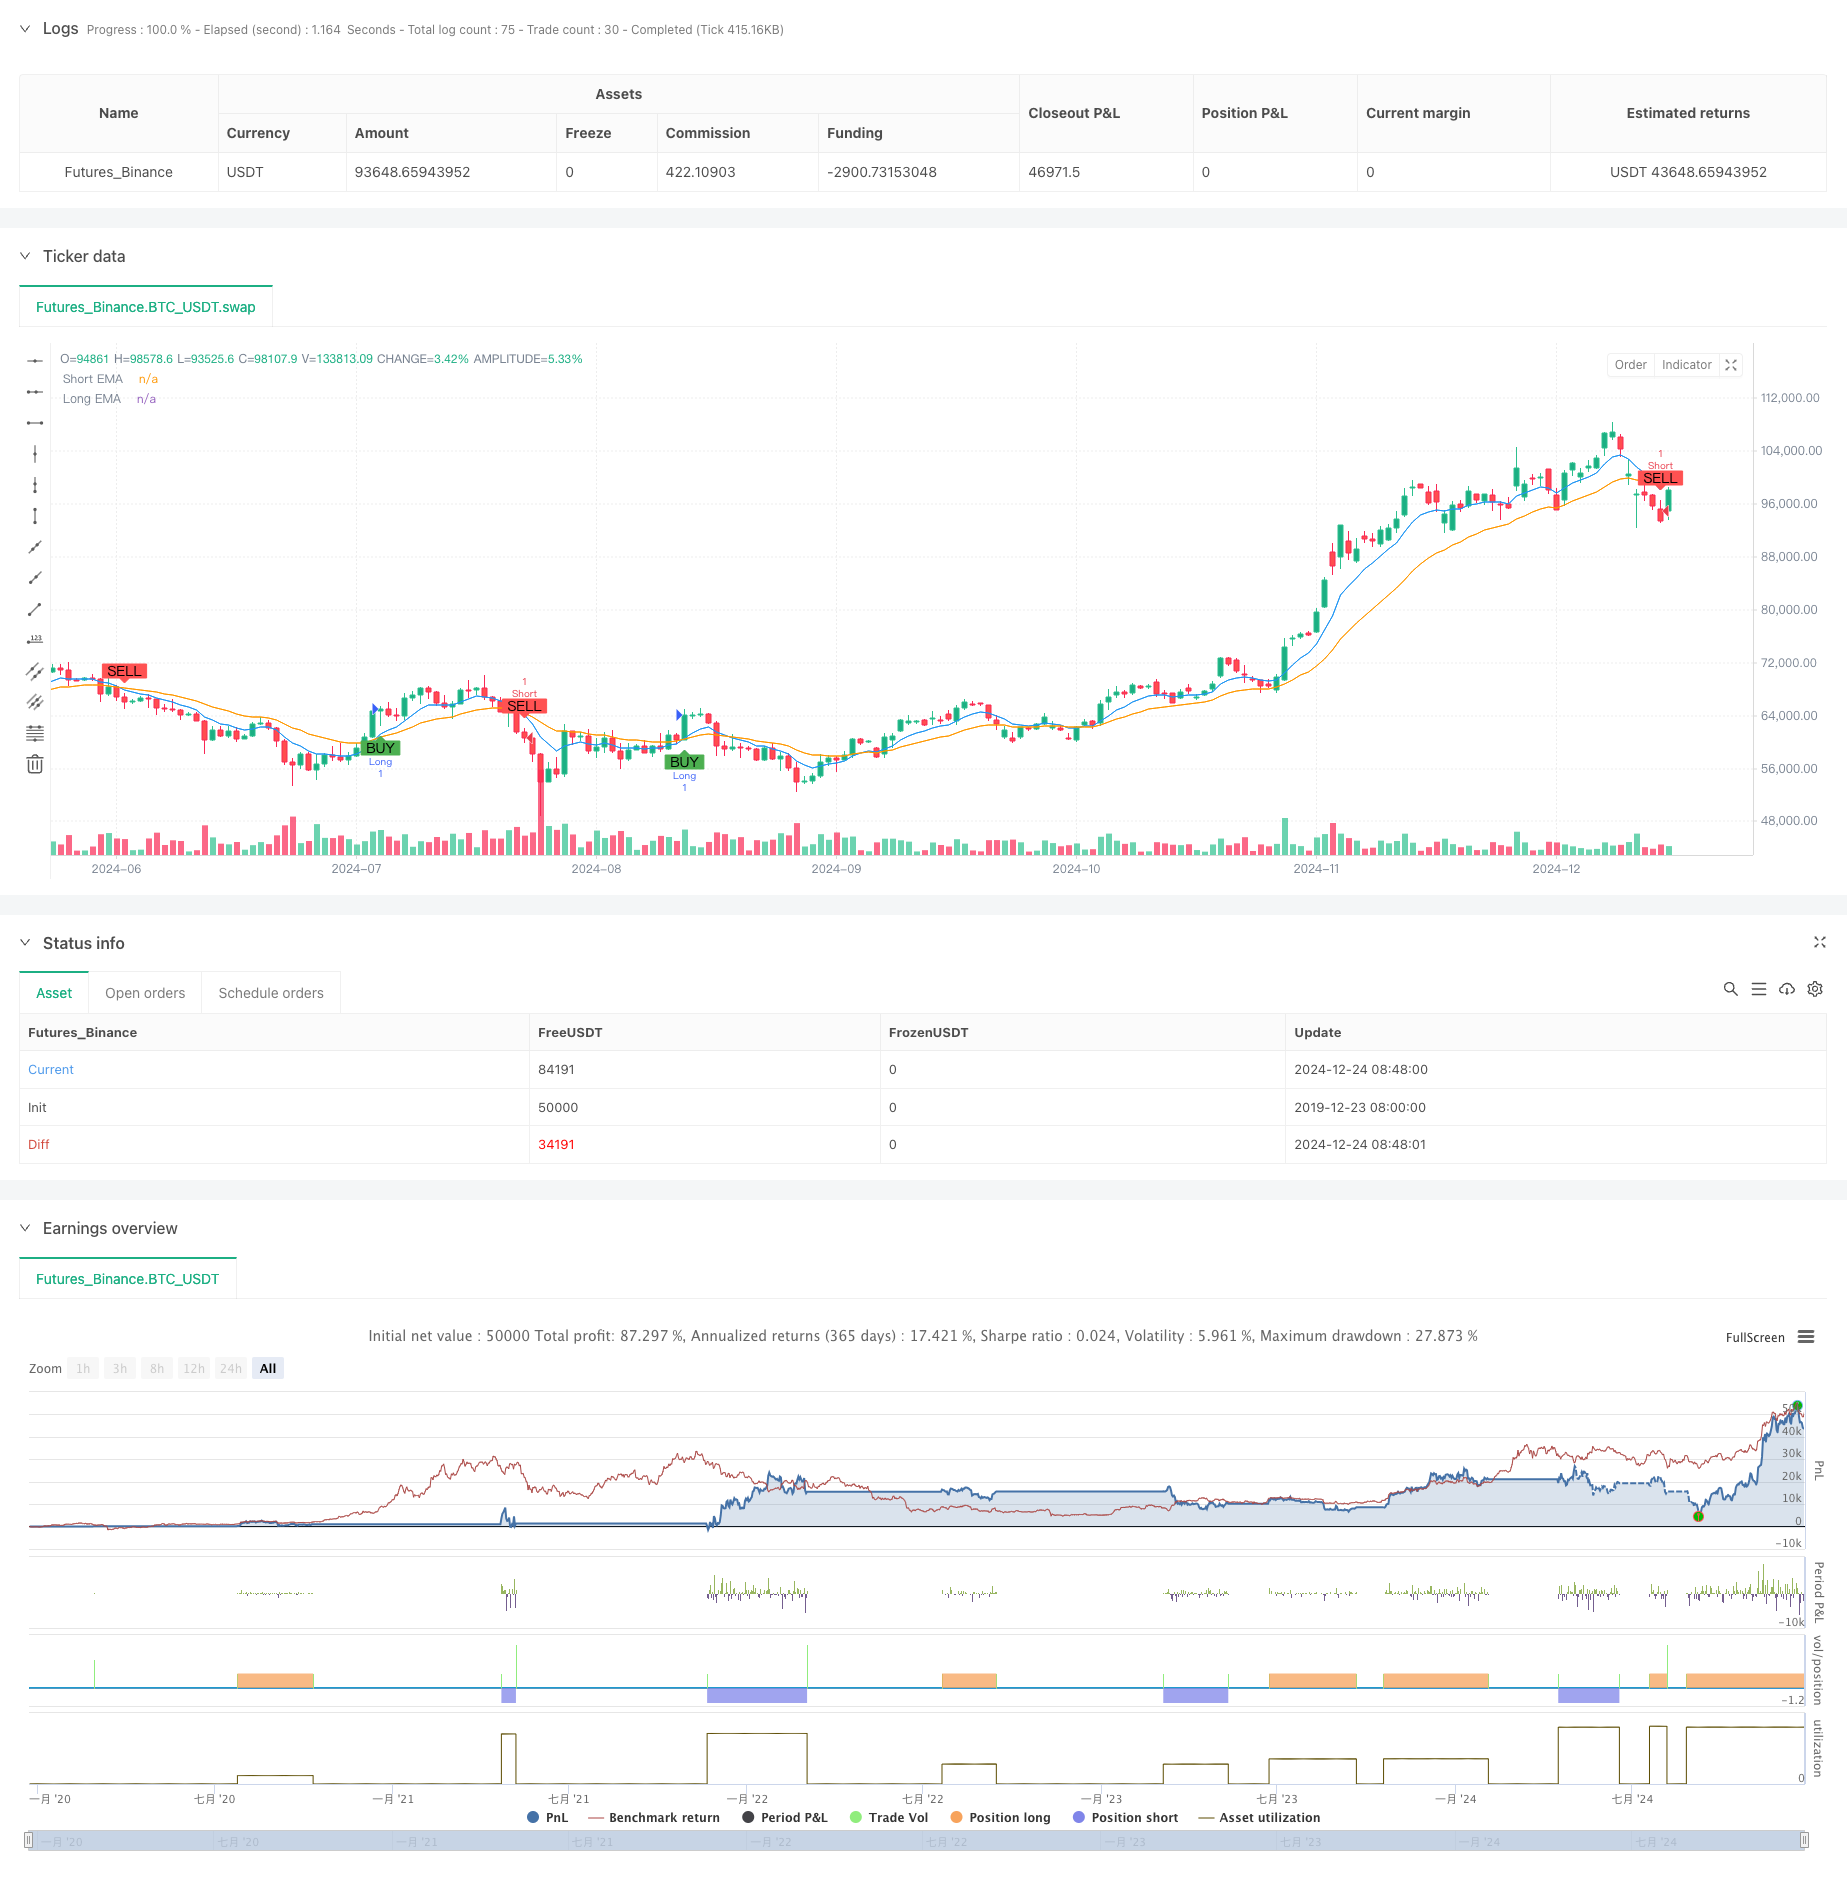
这是一个基于多重技术指标组合的高频波段交易策略。策略通过结合指数移动平均线(EMA)、相对强弱指数(RSI)、成交量分析和N周期价格形态识别等多个维度的市场信号,在短线交易中寻找最佳的入场时机。该策略采用严格的风险控制机制,通过设定止盈止损来保护资金安全。
策略原理
策略的核心逻辑是通过多维度信号的协同配合来确认交易方向: 1. 使用8周期和21周期的EMA交叉来判断短期趋势方向 2. 通过14周期RSI验证市场动能,RSI>50确认多头动能,RSI<50确认空头动能 3. 对比当前成交量与20周期平均成交量,确保市场活跃度 4. 通过对比最近5根K线与之前10根K线的最高最低点,识别潜在反转形态 只有当以上信号同时满足时,策略才会发出交易信号。多头信号出现时以市价开多,空头信号出现时以市价开空。同时设置1.5%止盈和0.7%止损来控制风险。
策略优势
- 多维度信号交叉验证,大大降低了虚假信号的影响
- 结合趋势跟踪与动量交易的优点,提高了策略的适应性
- 通过成交量确认,避免在市场清淡时期交易
- 采用N周期形态识别,能够及时发现市场反转信号
- 设置合理的止盈止损比例,有效控制风险
- 策略逻辑清晰,便于持续优化和调整参数
策略风险
- 在高波动市场中可能频繁触发止损
- 对做市商报价延迟较为敏感
- 多个指标同时满足的机会相对较少
- 在震荡市场中可能出现连续止损 应对措施:
- 可根据市场波动率动态调整止盈止损比例
- 建议在流动性较好的时段交易
- 可通过参数优化来平衡信号数量和质量
- 建议使用trailing stop动态止损以提高盈利能力
策略优化方向
- 引入自适应的参数调整机制,使策略能够根据市场状态自动优化参数
- 增加市场波动率过滤器,在过度波动的市场环境下暂停交易
- 开发更复杂的N周期形态识别算法,提高反转信号的准确性
- 引入资金管理模块,根据账户净值动态调整持仓规模
- 增加更多的时间周期验证,提高信号的可靠性
总结
该策略通过多维度技术指标的协同配合,在高频交易中寻找优质的交易机会。策略设计充分考虑了趋势、动量、成交量等市场特征,并通过严格的风险控制确保稳定性。虽然存在一定的优化空间,但整体而言是一个逻辑清晰、实用性强的交易策略。
策略源码
/*backtest
start: 2019-12-23 08:00:00
end: 2024-12-25 08:00:00
period: 1d
basePeriod: 1d
exchanges: [{"eid":"Futures_Binance","currency":"BTC_USDT"}]
*/

//@version=5
strategy("XRP/USD Scalping Strategy with Alerts", overlay=true)

// Input parameters
ema_short = input.int(8, title="Short EMA Period")
ema_long = input.int(21, title="Long EMA Period")
rsiperiod = input.int(14, title="RSI Period")
vol_lookback = input.int(20, title="Volume Lookback Period")
n_bars = input.int(5, title="N-Bars Detection")

take_profit_perc = input.float(1.5, title="Take Profit (%)") / 100
stop_loss_perc = input.float(0.7, title="Stop Loss (%)") / 100

// Indicators
ema_short_line = ta.ema(close, ema_short)
ema_long_line = ta.ema(close, ema_long)
rsi = ta.rsi(close, rsiperiod)
avg_volume = ta.sma(volume, vol_lookback)

// N-bar detection function
bullish_nbars = ta.lowest(low, n_bars) > ta.lowest(low, n_bars * 2)
bearish_nbars = ta.highest(high, n_bars) < ta.highest(high, n_bars * 2)

// Entry conditions
long_condition = ta.crossover(ema_short_line, ema_long_line) and rsi > 50 and volume > avg_volume and bullish_nbars
short_condition = ta.crossunder(ema_short_line, ema_long_line) and rsi < 50 and volume > avg_volume and bearish_nbars

// Plot signals
plotshape(long_condition, title="Buy Signal", location=location.belowbar, color=color.green, style=shape.labelup, text="BUY")
plotshape(short_condition, title="Sell Signal", location=location.abovebar, color=color.red, style=shape.labeldown, text="SELL")

// Strategy execution
if (long_condition)
    strategy.entry("Long", strategy.long)
    strategy.exit("TP/SL", from_entry="Long", limit=close * (1 + take_profit_perc), stop=close * (1 - stop_loss_perc))

if (short_condition)
    strategy.entry("Short", strategy.short)
    strategy.exit("TP/SL", from_entry="Short", limit=close * (1 - take_profit_perc), stop=close * (1 + stop_loss_perc))

// Plot EMA lines
plot(ema_short_line, color=color.blue, title="Short EMA")
plot(ema_long_line, color=color.orange, title="Long EMA")

// Create alerts
alertcondition(long_condition, title="Buy Alert", message="Buy Signal: EMA Crossover, RSI > 50, Volume > Avg, Bullish N-Bars")
alertcondition(short_condition, title="Sell Alert", message="Sell Signal: EMA Crossunder, RSI < 50, Volume > Avg, Bearish N-Bars")
相关推荐