概述
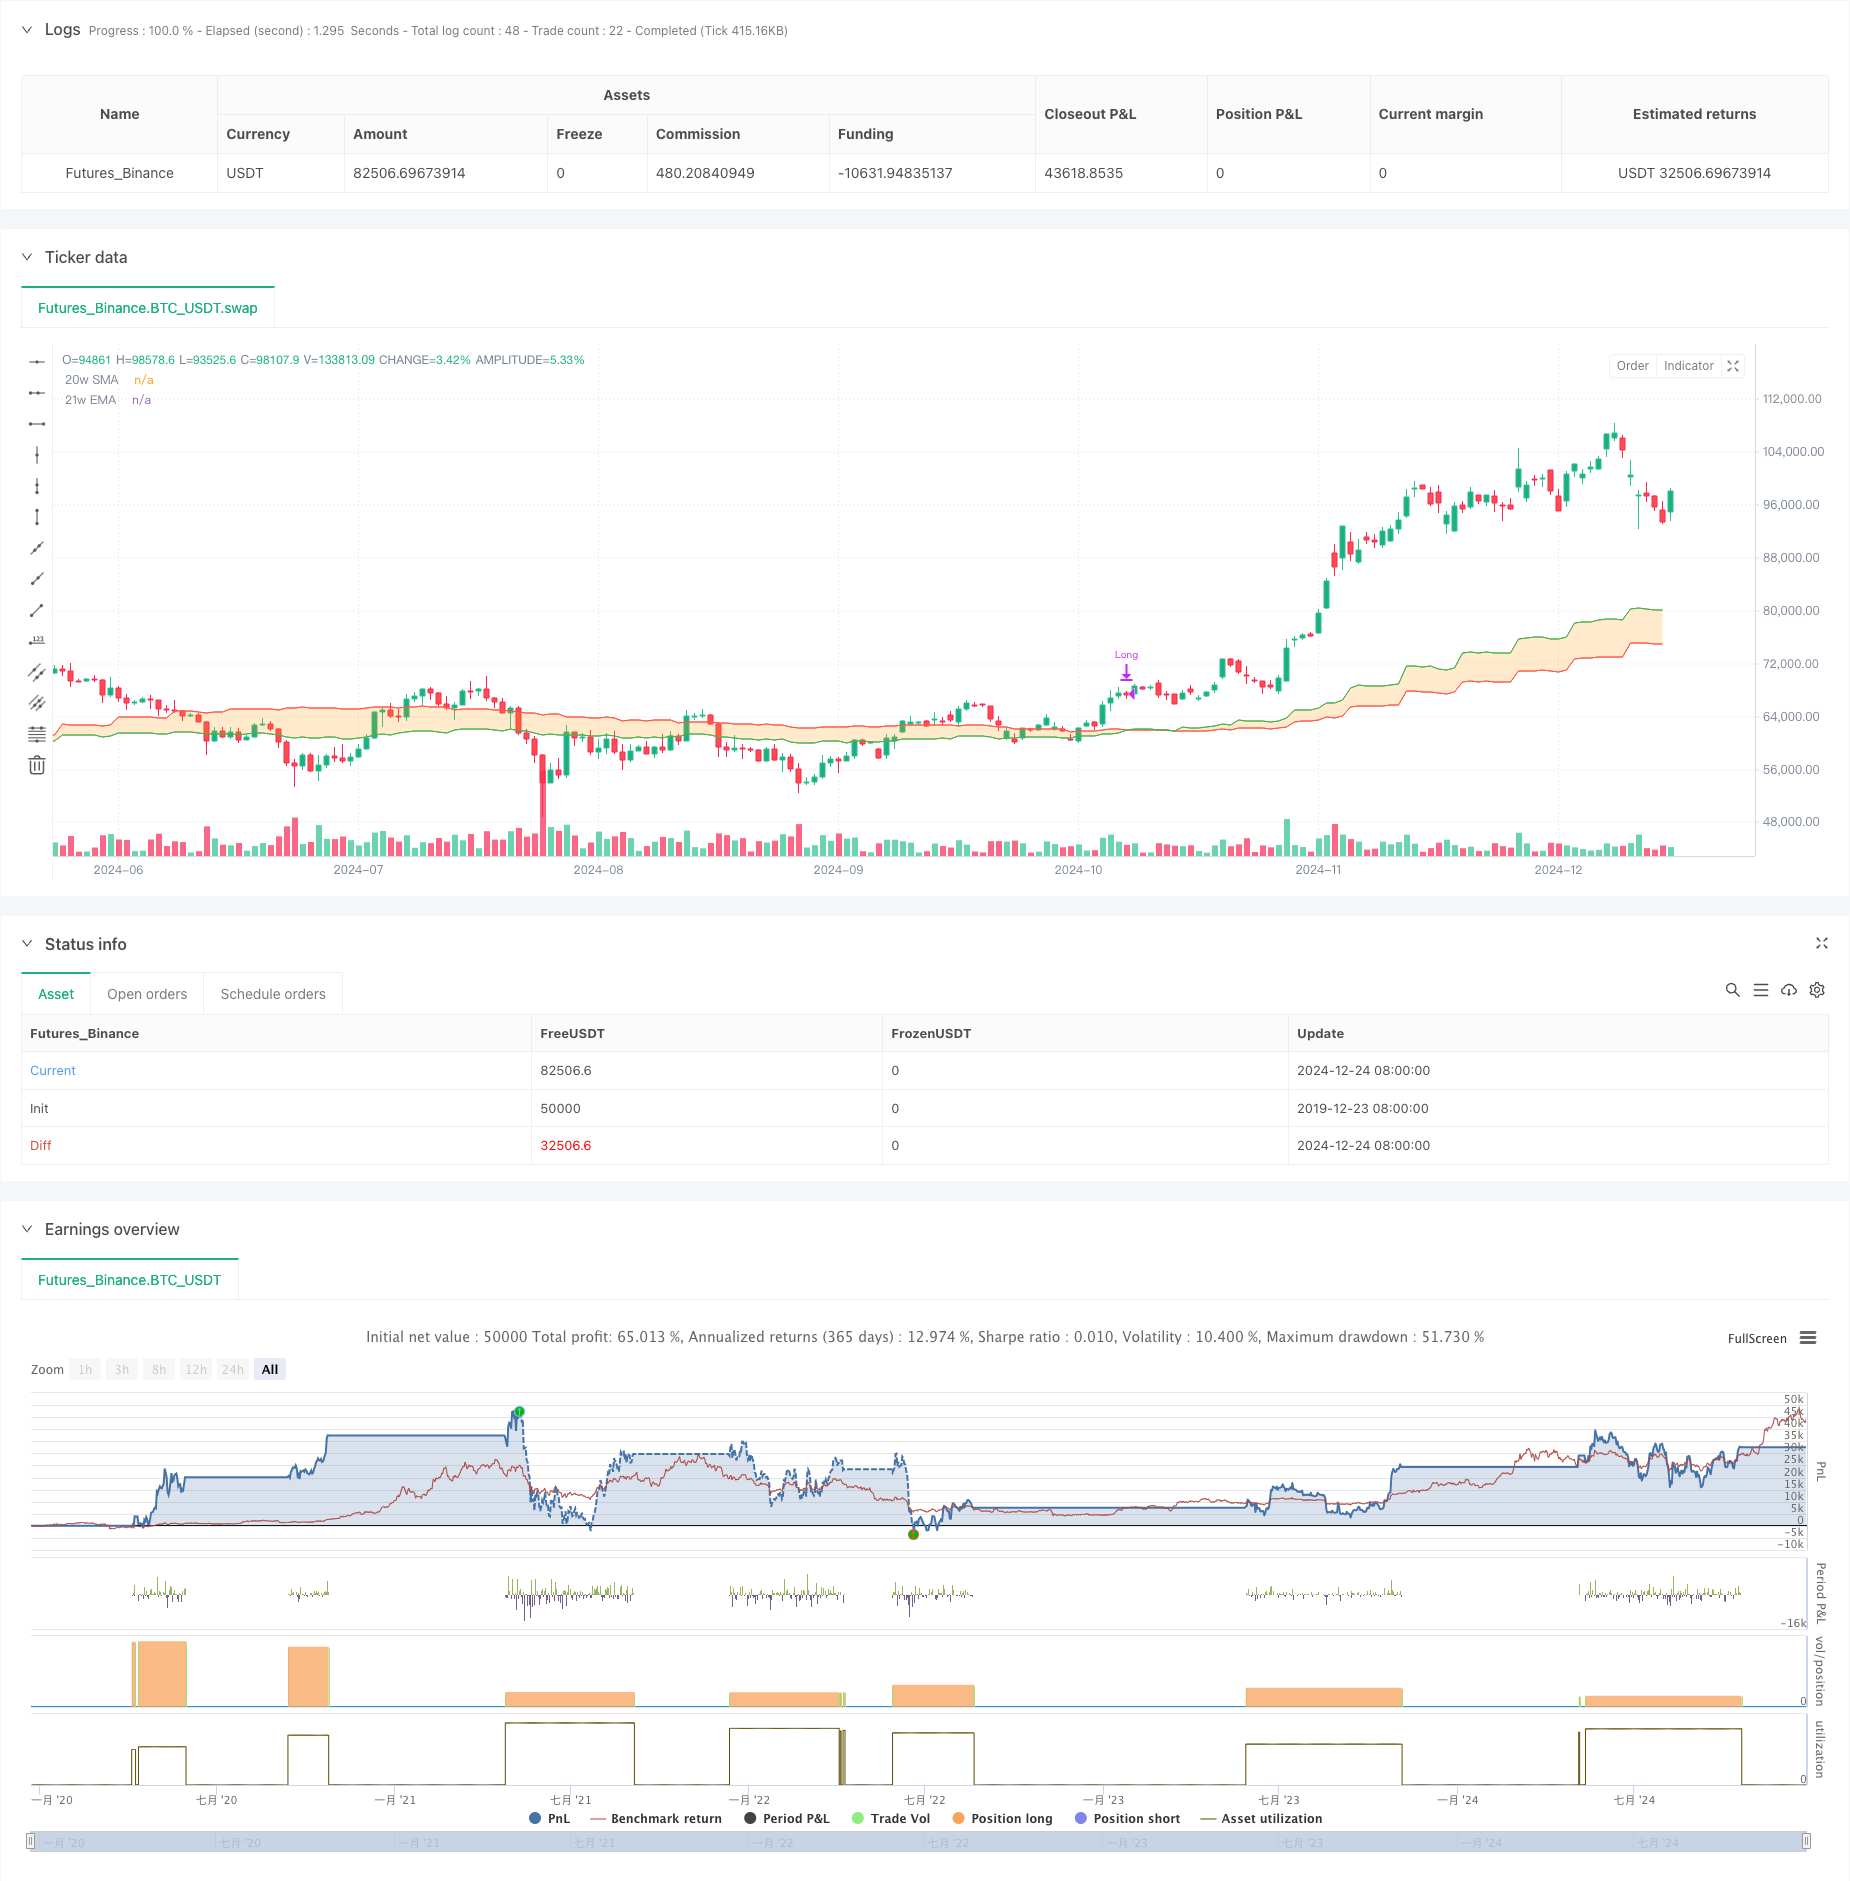
该策略是一个基于牛市支撑带(Bull Market Support Band)的趋势跟踪交易系统。它主要利用20周简单移动平均线(SMA)和21周指数移动平均线(EMA)的交叉信号来确定市场趋势方向,进而制定交易决策。策略在两条均线向上交叉时发出做多信号,在向下交叉时平仓,通过捕捉中长期趋势性机会来获取收益。
策略原理
策略的核心逻辑是通过监测20周SMA和21周EMA这两条均线的相对位置关系来判断市场趋势。当短期均线(20周SMA)从下方突破长期均线(21周EMA)时,表明市场可能形成上升趋势,系统会在此时开仓做多;当短期均线从上方跌破长期均线时,表明上升趋势可能结束,系统会在此时平仓出场。策略采用percent_of_equity方式进行仓位管理,设定交易佣金为0.1%,滑点为3个基点。
策略优势
- 趋势跟踪性强: 通过周线级别的均线交叉来判断趋势,能有效过滤短期市场噪音,捕捉中长期趋势性机会
- 风险控制合理: 采用动态的移动平均线作为止损参考,可以在市场转势时及时离场
- 参数设置科学: 20周和21周的参数设置既保证了信号的稳定性,又不会过度滞后
- 执行逻辑清晰: 入场和出场信号明确,不存在主观判断的成分
- 资金管理灵活: 支持按照账户净值比例进行开仓,可以动态调整持仓规模
策略风险
- 震荡市不适用: 在横盘震荡市场中,均线频繁交叉可能导致假突破,造成连续亏损
- 滑点影响较大: 周线级别的交易在实盘中可能面临较大滑点,影响策略表现
- 入场时机滞后: 均线交叉信号天然具有滞后性,可能错过最佳入场点位
- 回撤控制不足: 仅依靠均线交叉作为止损信号,在剧烈波动时可能承受较大回撤
- 资金要求较高: 周线级别的交易对资金量和心理承受能力都有较高要求
策略优化方向
- 增加筛选指标: 可以引入RSI、MACD等指标来确认趋势,提高信号可靠性
- 优化止损机制: 结合ATR指标设置动态止损,提升风险控制能力
- 完善仓位管理: 根据市场波动率动态调整仓位大小,实现更好的资金管理
- 添加趋势过滤: 引入长周期趋势判断,只在主趋势方向交易
- 改进交易执行: 优化交易规则以减少滑点影响,提高策略稳定性
总结
牛市支撑带交易策略是一个基于经典技术分析理论的趋势跟踪系统。通过周线级别的均线交叉来捕捉中长期趋势性机会,具有逻辑清晰、风险可控的特点。但策略在震荡市表现不佳,且存在一定的滞后性。通过增加辅助指标、优化止损机制和完善资金管理,策略还有较大的优化空间。适合具有一定资金规模和风险承受能力的投资者使用。
策略源码
/*backtest
start: 2019-12-23 08:00:00
end: 2024-12-25 08:00:00
period: 1d
basePeriod: 1d
exchanges: [{"eid":"Futures_Binance","currency":"BTC_USDT"}]
*/

// This source code is subject to the terms of the Mozilla Public License 2.0
// © zkdev

//@version=6
strategy(title='Demo GPT - Bull Market Support Band',
     overlay=true,
     default_qty_type=strategy.percent_of_equity,
     default_qty_value=100,
     commission_type=strategy.commission.percent,
     commission_value=0.1,
     slippage=3)

// -------------------------------------------------------------------------
// Compile-time timestamp constants for default date range
// (2018-01-01 00:00:00 UTC -> 1514764800000
//  2069-12-31 23:59:59 UTC -> 3155759999000)
// -------------------------------------------------------------------------
const int defaultFromDate = 1514764800000
const int defaultToDate   = 3155759999000

// -------------------------------------------------------------------------
// Inputs: date range
// -------------------------------------------------------------------------
fromDate = input(title='Start Date', defval=defaultFromDate)
toDate   = input(title='End Date',   defval=defaultToDate)

// -------------------------------------------------------------------------
// Indicator settings & calculations
// -------------------------------------------------------------------------
smaLength = 20
emaLength = 21

source = close
sma    = ta.sma(source, smaLength)
ema    = ta.ema(source, emaLength)

// -------------------------------------------------------------------------
// Fetch weekly SMA & EMA
// -------------------------------------------------------------------------
outSma = request.security(syminfo.tickerid, 'W', sma, gaps=barmerge.gaps_on, lookahead=barmerge.lookahead_off)
outEma = request.security(syminfo.tickerid, 'W', ema, gaps=barmerge.gaps_on, lookahead=barmerge.lookahead_off)

// -------------------------------------------------------------------------
// Plot visuals (20w SMA, 21w EMA, fill in between)
// -------------------------------------------------------------------------
smaPlot = plot(outSma, color=color.new(color.red,   0), title='20w SMA')
emaPlot = plot(outEma, color=color.new(color.green, 0), title='21w EMA')
fill(smaPlot, emaPlot, color=color.new(color.orange, 75), fillgaps=true)

// -------------------------------------------------------------------------
// We evaluate crossover/crossunder on *every bar* and store the result
// -------------------------------------------------------------------------
crossUp   = ta.crossover(outSma, outEma)
crossDown = ta.crossunder(outSma, outEma)

// -------------------------------------------------------------------------
// Trade logic: only operate within chosen date range
// Buy when outSma crosses above outEma; Sell (close) when outSma crosses below outEma
// -------------------------------------------------------------------------
inDateRange = true

if inDateRange
    // If we have a crossUp event on this bar, buy (go Long)
    if crossUp
        strategy.entry('Long', strategy.long)

    // If we have a crossDown event on this bar, sell (close Long)
    if crossDown
        strategy.close('Long')
相关推荐