概述
该策略是一个结合了指数移动平均线(EMA)交叉和相对强弱指标(RSI)的自动化交易系统。它通过EMA快线和慢线的交叉来识别趋势方向,同时利用RSI作为趋势确认指标,还包含了完整的资金管理和风险控制机制。系统采用固定风险和盈利目标的方式来管理每笔交易,通过动态计算持仓规模来确保风险的一致性。
策略原理
策略的核心逻辑基于以下几个关键要素: 1. 使用9周期和21周期的EMA来识别趋势转折点,快线上穿慢线代表上涨趋势开始,下穿代表下跌趋势开始 2. RSI指标作为趋势确认工具,在买入信号出现时要求RSI>50,卖出信号时要求RSI<50 3. 风险管理系统设定每笔交易的最大亏损额度为1000,目标盈利为5000,通过调整持仓规模来实现固定的风险收益比 4. 系统采用固定点数(25点)的止损设置,并根据风险金额动态计算开仓数量 5. 交易失败检测机制可以及时发现止损出场的交易,并在图表上标记失败点位
策略优势
- 结合趋势跟踪和动量确认的双重验证机制,提高了交易信号的可靠性
- 完善的资金管理系统,每笔交易的风险固定,避免了过度损失
- 清晰的风险收益比设置(1:5),有利于长期盈利
- 系统具备自动化的交易执行能力,减少了人为情绪干扰
- 失败交易的可视化标记有助于策略优化和回测分析
策略风险
- EMA交叉策略在震荡市场可能产生频繁的假信号
- 固定点数止损可能不够灵活,在波动性变化时难以适应
- 较大的风险收益比(1:5)可能导致胜率降低
- RSI指标在极端市场条件下可能失效
- 固定的交易手数可能不适合所有市场条件
策略优化方向
- 引入自适应的止损机制,如基于ATR的动态止损
- 增加市场波动性过滤器,在高波动期间调整策略参数
- 考虑添加成交量指标作为辅助确认工具
- 开发动态的手数调整机制,根据市场情况自适应
- 引入更多的趋势确认工具,如MACD或布林带
总结
该策略通过结合EMA交叉和RSI指标构建了一个完整的交易系统,包含信号生成、风险管理和交易执行等关键环节。虽然存在一些需要优化的地方,但整体框架设计合理,特别是在资金管理方面的考虑较为周全。通过进一步优化和完善,该策略有望在实际交易中取得更好的表现。
策略源码
/*backtest
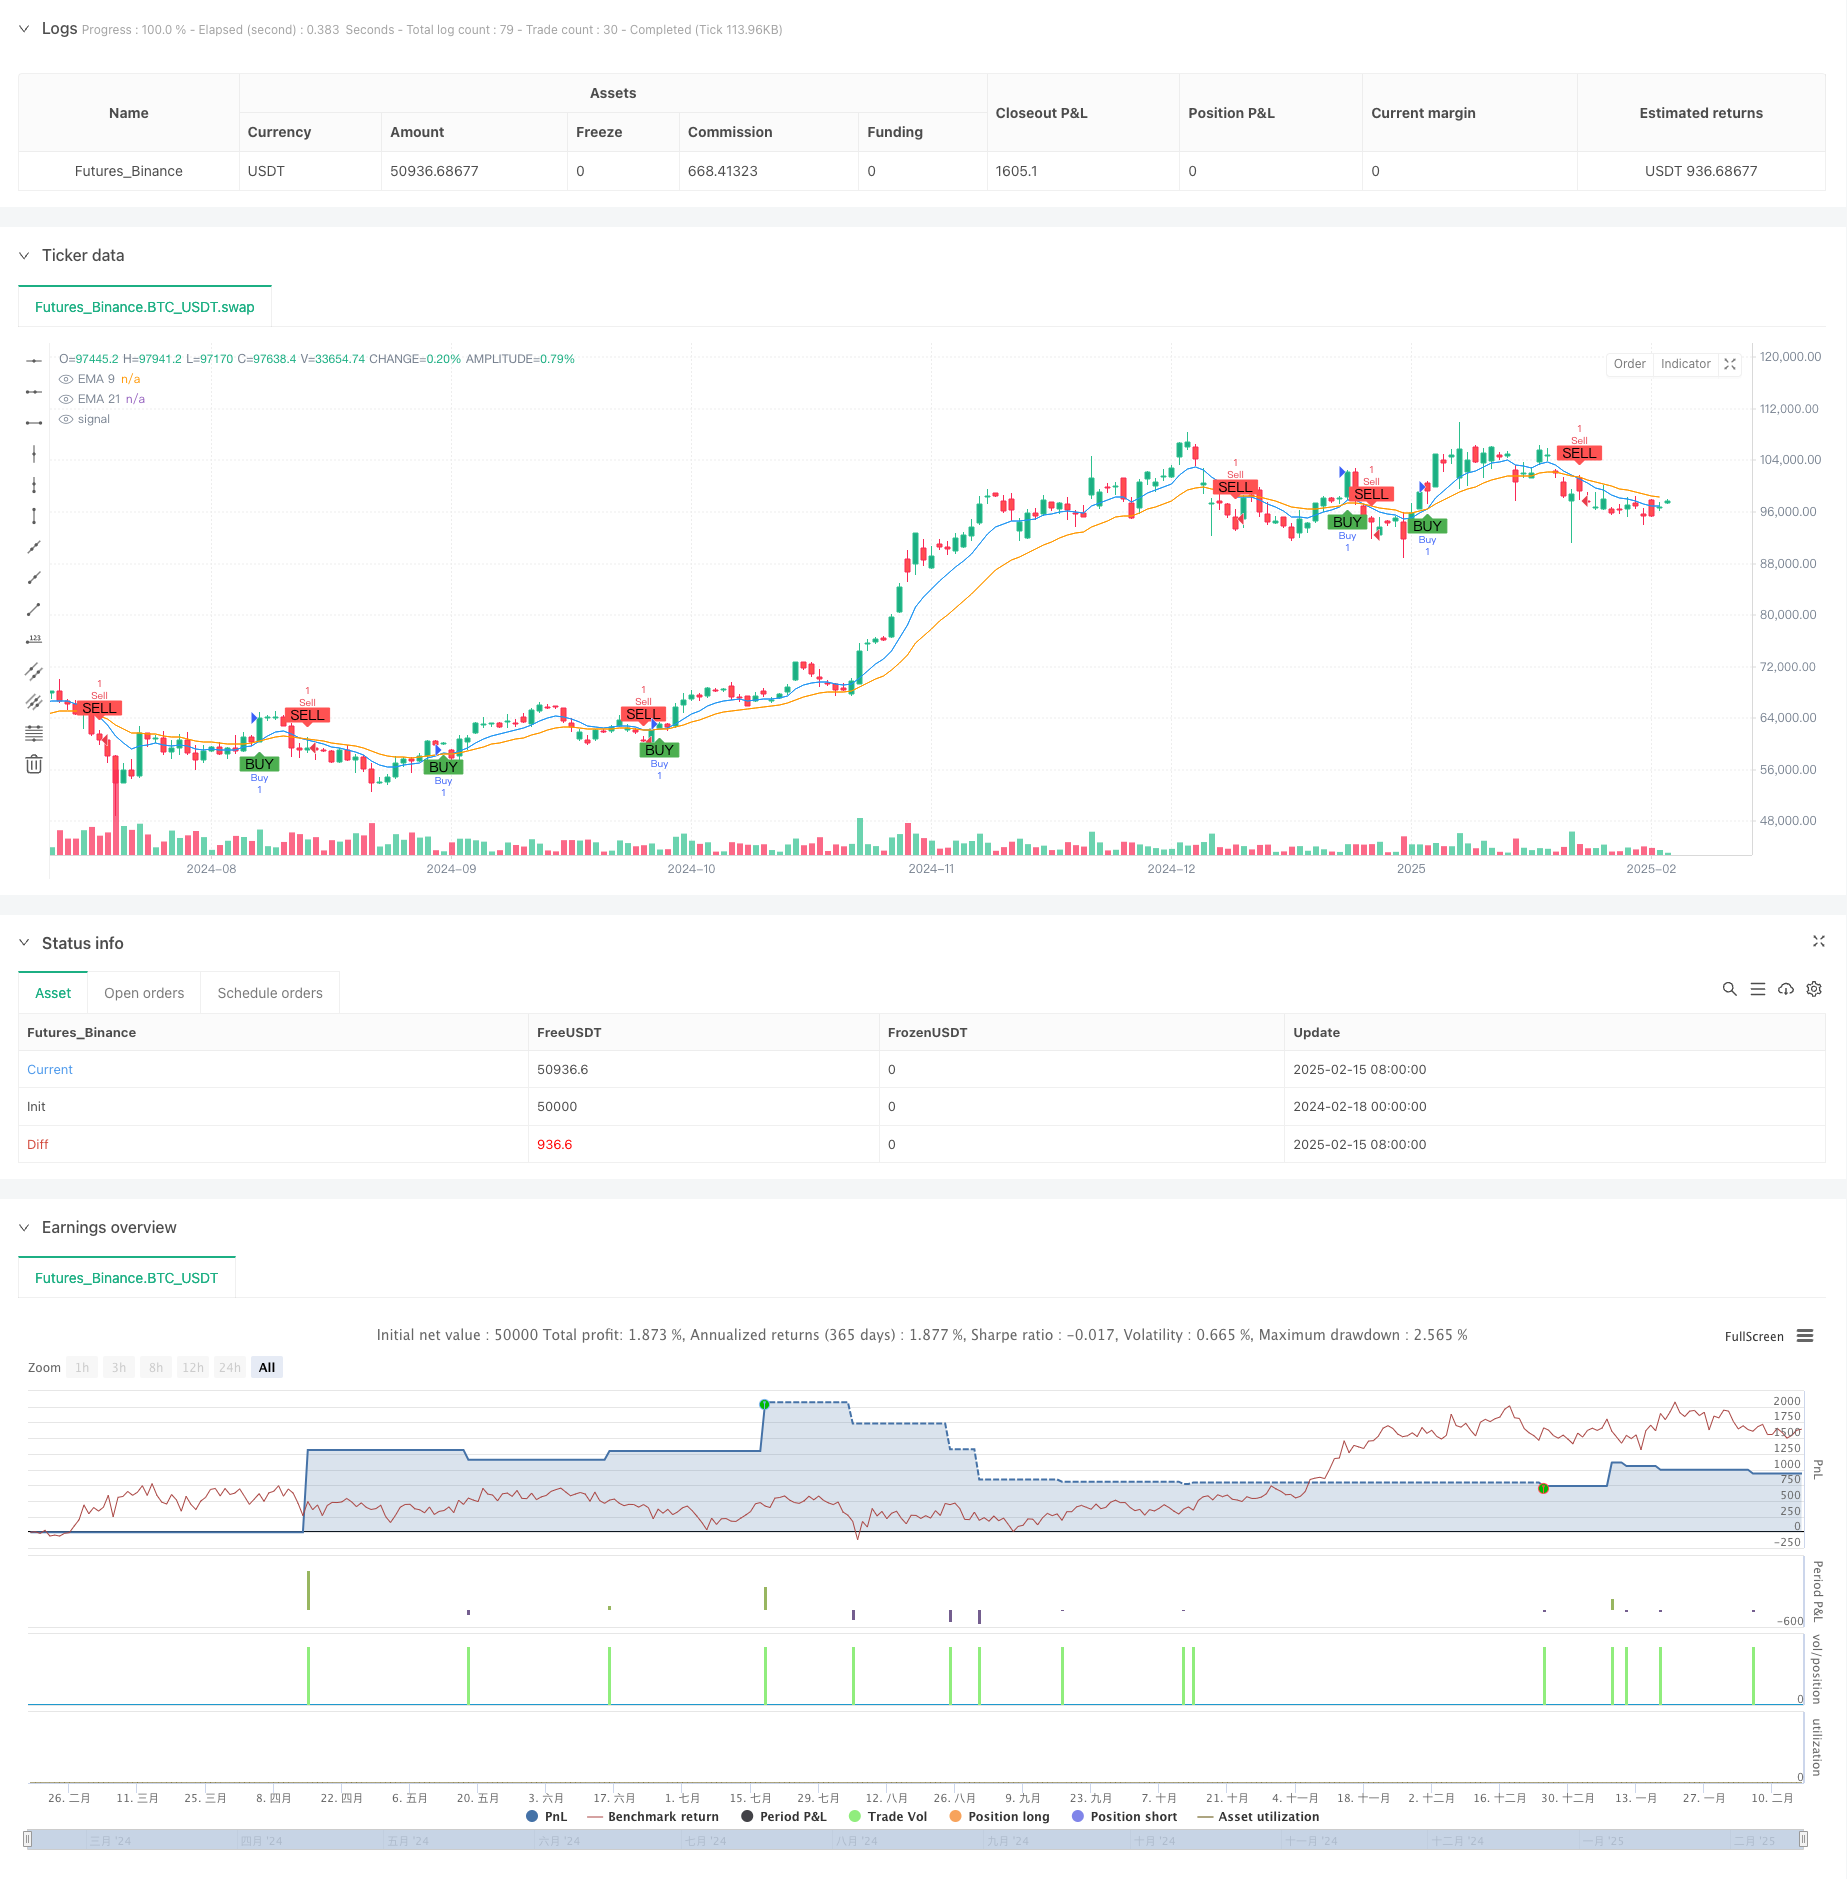
start: 2024-02-18 00:00:00
end: 2025-02-16 08:00:00
period: 1d
basePeriod: 1d
exchanges: [{"eid":"Futures_Binance","currency":"BTC_USDT"}]
*/
// This Pine Script™ code is subject to the terms of the Mozilla Public License 2.0 at https://mozilla.org/MPL/2.0/
// © Lukhi24
//@version=6
strategy("Lukhi EMA Crossover_TWL Strategy" , overlay=true)
// Input Parameters
capital = 15000 // Capital: ₹15,000
risk_per_trade = 1000 // Risk per Trade: ₹1,000
target_per_trade = 5000 // Take Profit per Trade: ₹5,000
lot_size = input.int(1, title="Lot Size") // Nifty option lot size (adjust as per your instrument)
stop_loss_distance = input.float(25, title="Stop Loss Distance (Points)") // Fixed stop-loss in points (adjustable)
// EMA Parameters
short_ema_length = input.int(9, title="Short EMA Length")
long_ema_length = input.int(21, title="Long EMA Length")
// RSI Parameters
rsi_length = input.int(14, title="RSI Length")
rsi_overbought = input.float(70, title="RSI Overbought Level")
rsi_oversold = input.float(30, title="RSI Oversold Level")
// Calculations
ema_short = ta.ema(close, short_ema_length)
ema_long = ta.ema(close, long_ema_length)
rsi = ta.rsi(close, rsi_length)
// Buy and Sell Signals
buy_signal = ta.crossover(ema_short, ema_long) and rsi > 50
sell_signal = ta.crossunder(ema_short, ema_long) and rsi < 50
// Plot EMAs on the chart
plot(ema_short, color=color.blue, title="EMA 9")
plot(ema_long, color=color.orange, title="EMA 21")
// Risk Management: Position size based on stop-loss distance
position_size = risk_per_trade / stop_loss_distance
// Stop Loss and Take Profit Levels
long_stop_loss = close - stop_loss_distance
long_take_profit = close + (target_per_trade / position_size)
short_stop_loss = close + stop_loss_distance
short_take_profit = close - (target_per_trade / position_size)
// Strategy Logic: Entry, Stop Loss, and Take Profit
if (buy_signal)
strategy.entry("Buy", strategy.long, qty=lot_size)
strategy.exit("Exit Buy", "Buy", stop=long_stop_loss, limit=long_take_profit)
if (sell_signal)
strategy.entry("Sell", strategy.short, qty=lot_size)
strategy.exit("Exit Sell", "Sell", stop=short_stop_loss, limit=short_take_profit)
// Track Trade Result and Detect Failures
long_trade_loss = strategy.position_size > 0 and close <= long_stop_loss
short_trade_loss = strategy.position_size < 0 and close >= short_stop_loss
// Plot Buy and Sell signals on the chart
plotshape(buy_signal, location=location.belowbar, color=color.green, style=shape.labelup, title="Buy Signal", text="BUY")
plotshape(sell_signal, location=location.abovebar, color=color.red, style=shape.labeldown, title="Sell Signal", text="SELL")
// Plot Failure Signals
plotshape(long_trade_loss, location=location.belowbar, color=color.red, style=shape.cross, title="Long Trade Failed", text="Failed")
plotshape(short_trade_loss, location=location.abovebar, color=color.red, style=shape.cross, title="Short Trade Failed", text="Failed")
相关推荐