概述
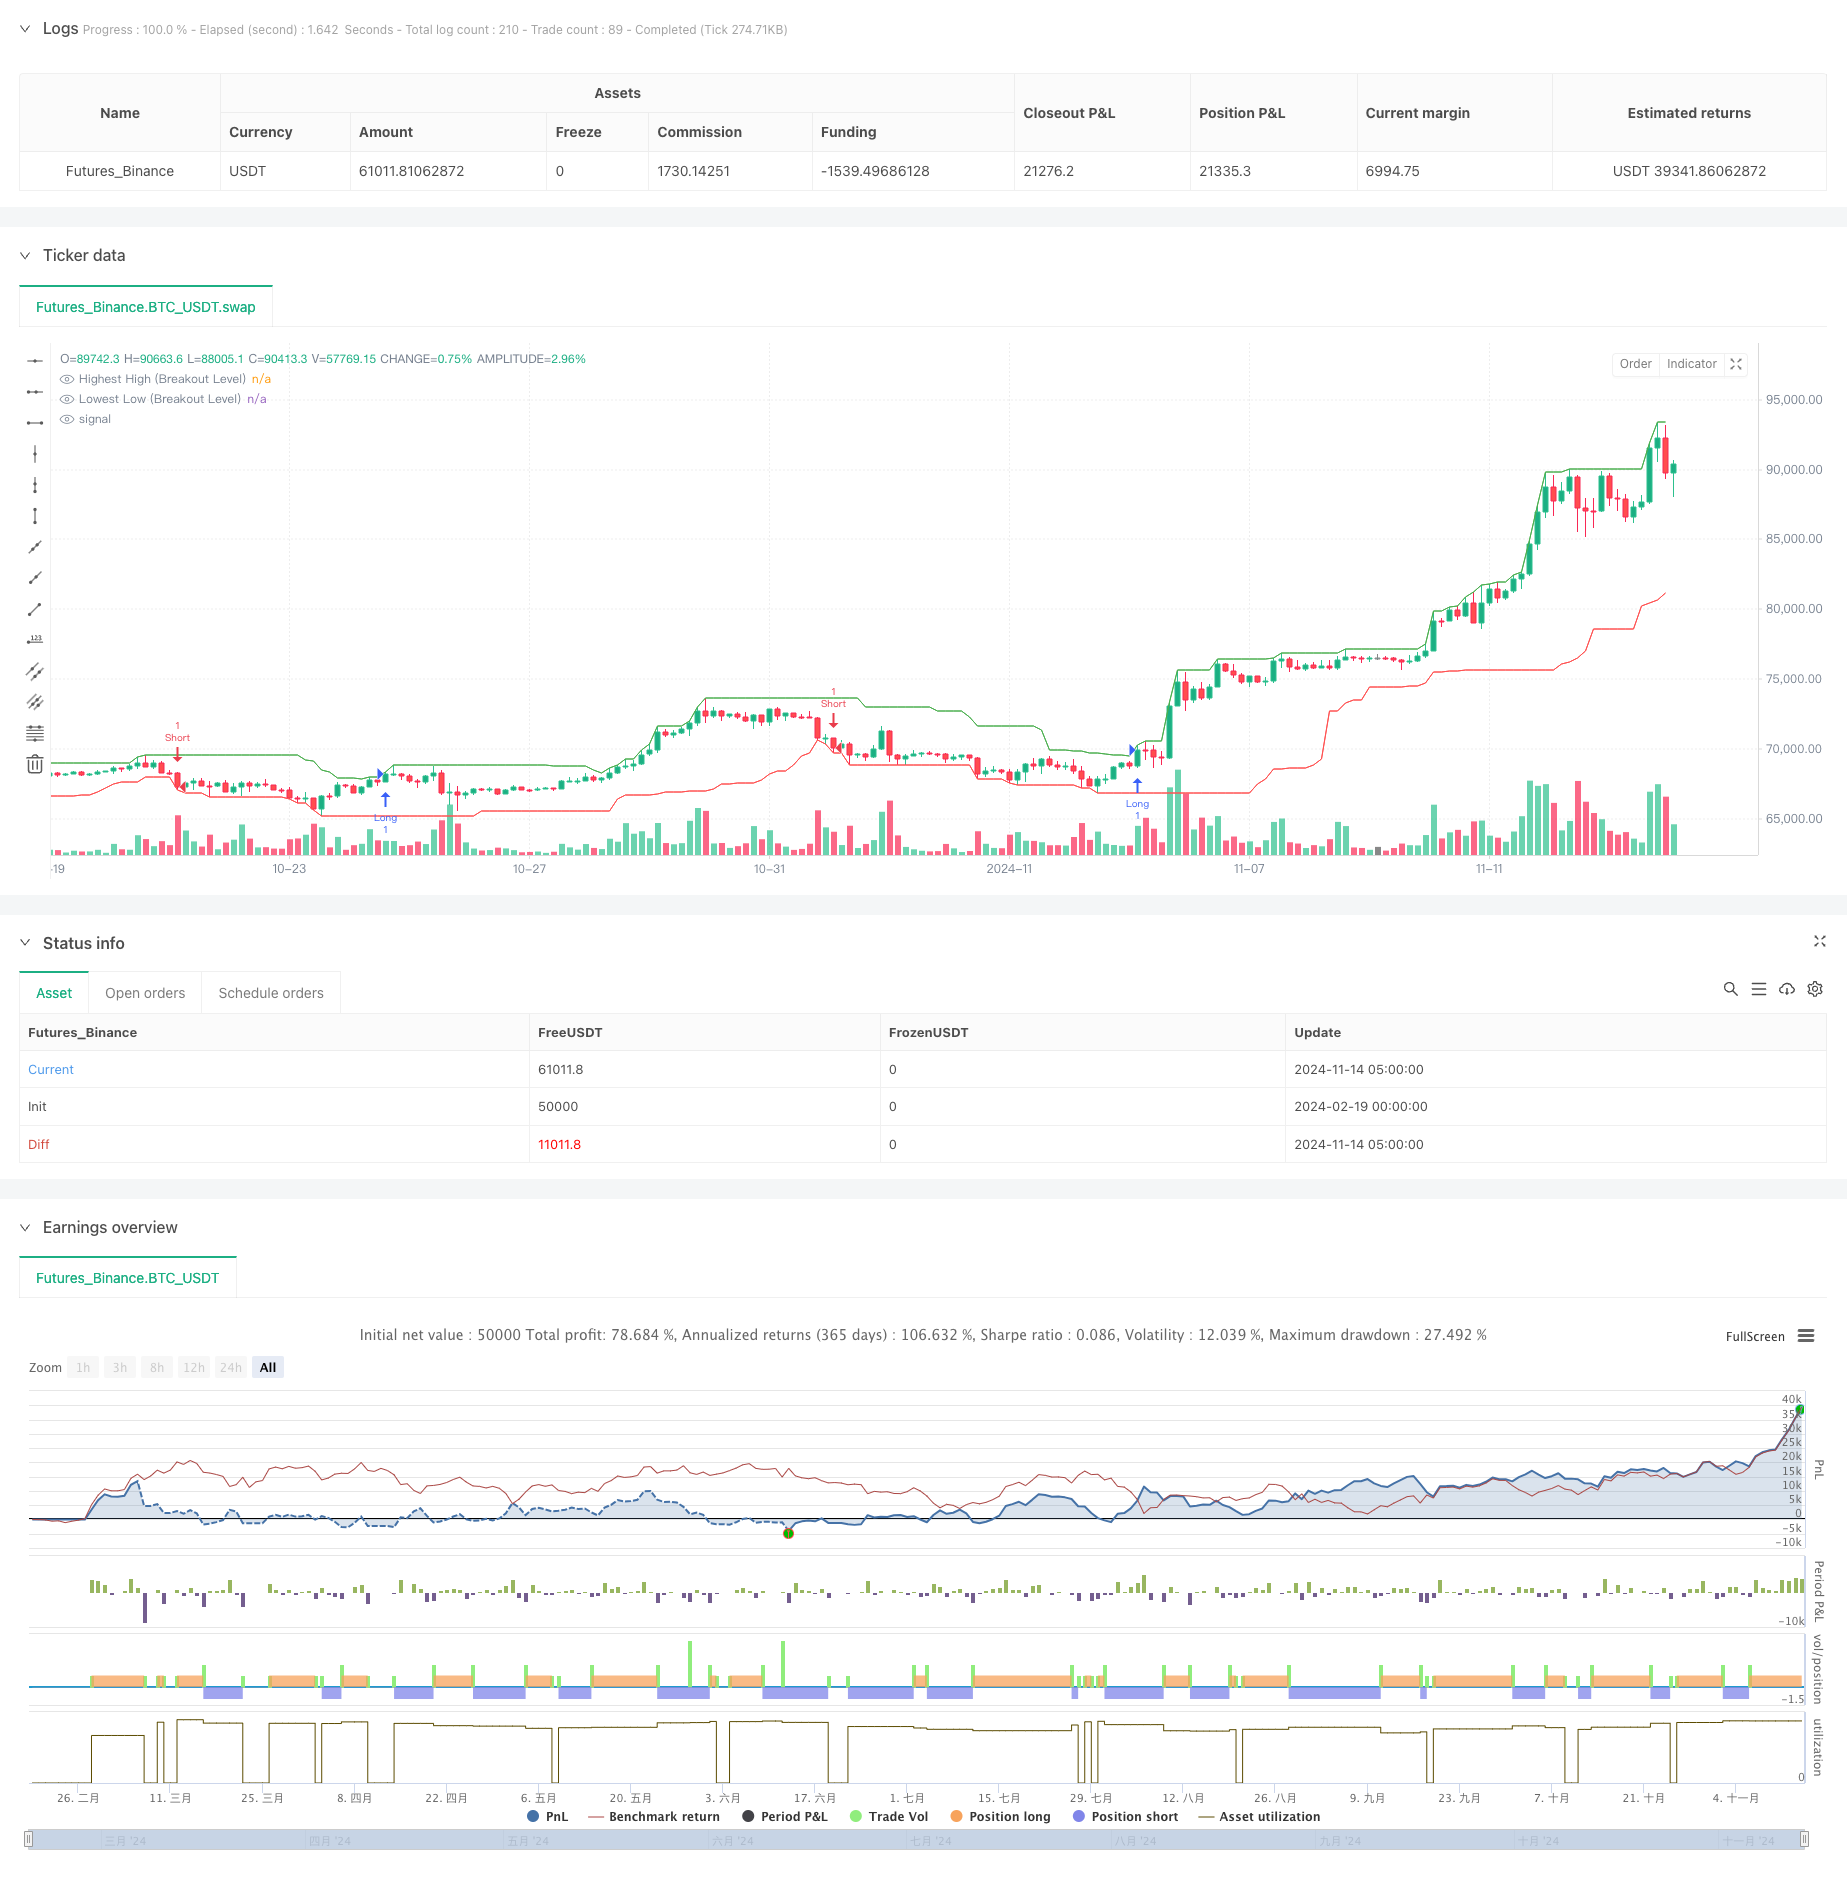
这是一个基于纯价格行为的突破交易策略,采用1:5的高风险回报比设计。策略通过识别关键价格水平的突破来进行交易,并结合市场结构动态设置止损和获利目标。策略不依赖任何技术指标,完全基于实时价格行为做出交易决策。
策略原理
策略的核心逻辑包括以下几个关键部分: 1. 通过回溯期识别最高价和最低价水平,形成突破参考点 2. 当收盘价突破前期高点时开多仓,突破前期低点时开空仓 3. 基于近期波动设置动态止损位置,多仓在低点设置止损,空仓在高点设置止损 4. 根据1:5的风险回报比例计算获利目标位置 5. 设置每日最大交易次数限制,避免过度交易 整个交易过程完全基于价格行为,不使用任何技术指标作为参考。
策略优势
- 纯价格行为交易,避免指标滞后带来的干扰
- 采用高风险回报比设计,每笔交易的潜在收益是风险的5倍
- 动态止损设置,根据市场结构自适应调整
- 清晰的交易信号和视觉标记,便于交易执行
- 参数可调整性强,适应不同市场环境
- 严格的风险控制,包括每日交易次数限制
策略风险
- 在震荡市场可能产生频繁的假突破信号
- 高风险回报比可能导致胜率相对较低
- 突破后的回调可能触发止损
- 市场波动性变化可能影响策略表现
- 需要较大的价格移动才能达到获利目标
缓解措施: - 在趋势市场中使用该策略 - 避免在重要新闻发布期间交易 - 合理设置头寸规模 - 定期检查和优化参数
策略优化方向
- 增加趋势过滤器,只在主趋势方向交易
- 添加成交量确认机制,提高突破的可靠性
- 根据波动率动态调整风险回报比
- 引入多时间周期分析,提高交易准确性
- 开发更智能的止损机制,如跟踪止损
- 增加市场环境识别功能,自适应调整策略参数
总结
这是一个设计严谨、逻辑清晰的价格行为交易策略。通过高风险回报比的设计,在有效控制风险的同时追求可观收益。策略的优势在于纯价格驱动、参数灵活可调、风险控制完善。虽然存在一定的假突破风险,但通过建议的优化方向可以进一步提升策略的稳定性和可靠性。该策略适合在趋势明显的市场环境中使用,并需要交易者严格遵守交易纪律。
策略源码
/*backtest
start: 2024-02-19 00:00:00
end: 2024-11-14 08:00:00
period: 3h
basePeriod: 3h
exchanges: [{"eid":"Futures_Binance","currency":"BTC_USDT"}]
*/

//@version=6
strategy("Filtered Price Action Breakout", overlay=true)

// === INPUTS ===
lookback = input.int(20, title="Breakout Lookback Period", minval=5)
stopLookback = input.int(10, title="Stop Loss Lookback Period", minval=3)
rrMultiplier = input.float(5.0, title="Risk-to-Reward Multiplier", step=0.1)
maxTradesPerDay = input.int(5, title="Max Trades Per Day", minval=1)

// Ensure there are enough bars for calculations
inRange = bar_index >= lookback

// === CALCULATIONS ===
// Highest high and lowest low over the 'lookback' period
highestHigh = ta.highest(high, lookback)
lowestLow = ta.lowest(low, lookback)

// Define breakout conditions (using previous bar's level)
bullBreakout = ta.crossover(close, highestHigh[1])
bearBreakout = ta.crossunder(close, lowestLow[1])

// Store breakout signals in variables to prevent inconsistencies
bullBreakoutSignal = bullBreakout
bearBreakoutSignal = bearBreakout

// Determine stop levels based on recent swing lows/highs
longStop = ta.lowest(low, stopLookback)
shortStop = ta.highest(high, stopLookback)

// Track number of trades per day (fixing boolean condition issue)
newDay = ta.change(time("D")) != 0
todayTrades = ta.barssince(newDay)
tradeCount = 0
if newDay
    tradeCount := 0
else
    tradeCount := tradeCount + 1

// === STRATEGY LOGIC: ENTRY & EXIT ===
if bullBreakoutSignal and tradeCount < maxTradesPerDay
    entryPrice = close
    stopLevel = longStop
    risk = entryPrice - stopLevel
    if risk > 0
        target = entryPrice + rrMultiplier * risk
        strategy.entry("Long", strategy.long)
        strategy.exit("Long Exit", from_entry="Long", stop=stopLevel, limit=target)
        tradeCount := tradeCount + 1

        // // Draw Markups
        // label.new(bar_index, entryPrice, text="Long Entry", color=color.green, textcolor=color.white, size=size.small, style=label.style_label_down)
        // line.new(x1=bar_index, y1=entryPrice, x2=bar_index + 5, y2=entryPrice, color=color.green, width=2)
        // line.new(x1=bar_index, y1=stopLevel, x2=bar_index + 5, y2=stopLevel, color=color.red, width=2, style=line.style_dotted)
        // line.new(x1=bar_index, y1=target, x2=bar_index + 5, y2=target, color=color.blue, width=2, style=line.style_dashed)
        // label.new(bar_index, stopLevel, text="Stop Loss", color=color.red, textcolor=color.white, size=size.small, style=label.style_label_down)
        // label.new(bar_index, target, text="Target", color=color.blue, textcolor=color.white, size=size.small, style=label.style_label_up)

if bearBreakoutSignal and tradeCount < maxTradesPerDay
    entryPrice = close
    stopLevel = shortStop
    risk = stopLevel - entryPrice
    if risk > 0
        target = entryPrice - rrMultiplier * risk
        strategy.entry("Short", strategy.short)
        strategy.exit("Short Exit", from_entry="Short", stop=stopLevel, limit=target)
        tradeCount := tradeCount + 1

        // // Draw Markups
        // label.new(bar_index, entryPrice, text="Short Entry", color=color.red, textcolor=color.white, size=size.small, style=label.style_label_up)
        // line.new(x1=bar_index, y1=entryPrice, x2=bar_index + 5, y2=entryPrice, color=color.red, width=2)
        // line.new(x1=bar_index, y1=stopLevel, x2=bar_index + 5, y2=stopLevel, color=color.green, width=2, style=line.style_dotted)
        // line.new(x1=bar_index, y1=target, x2=bar_index + 5, y2=target, color=color.blue, width=2, style=line.style_dashed)
        // label.new(bar_index, stopLevel, text="Stop Loss", color=color.green, textcolor=color.white, size=size.small, style=label.style_label_up)
        // label.new(bar_index, target, text="Target", color=color.blue, textcolor=color.white, size=size.small, style=label.style_label_down)

// === PLOTTING ===
plot(highestHigh, color=color.green, title="Highest High (Breakout Level)")
plot(lowestLow, color=color.red, title="Lowest Low (Breakout Level)")
相关推荐