概述
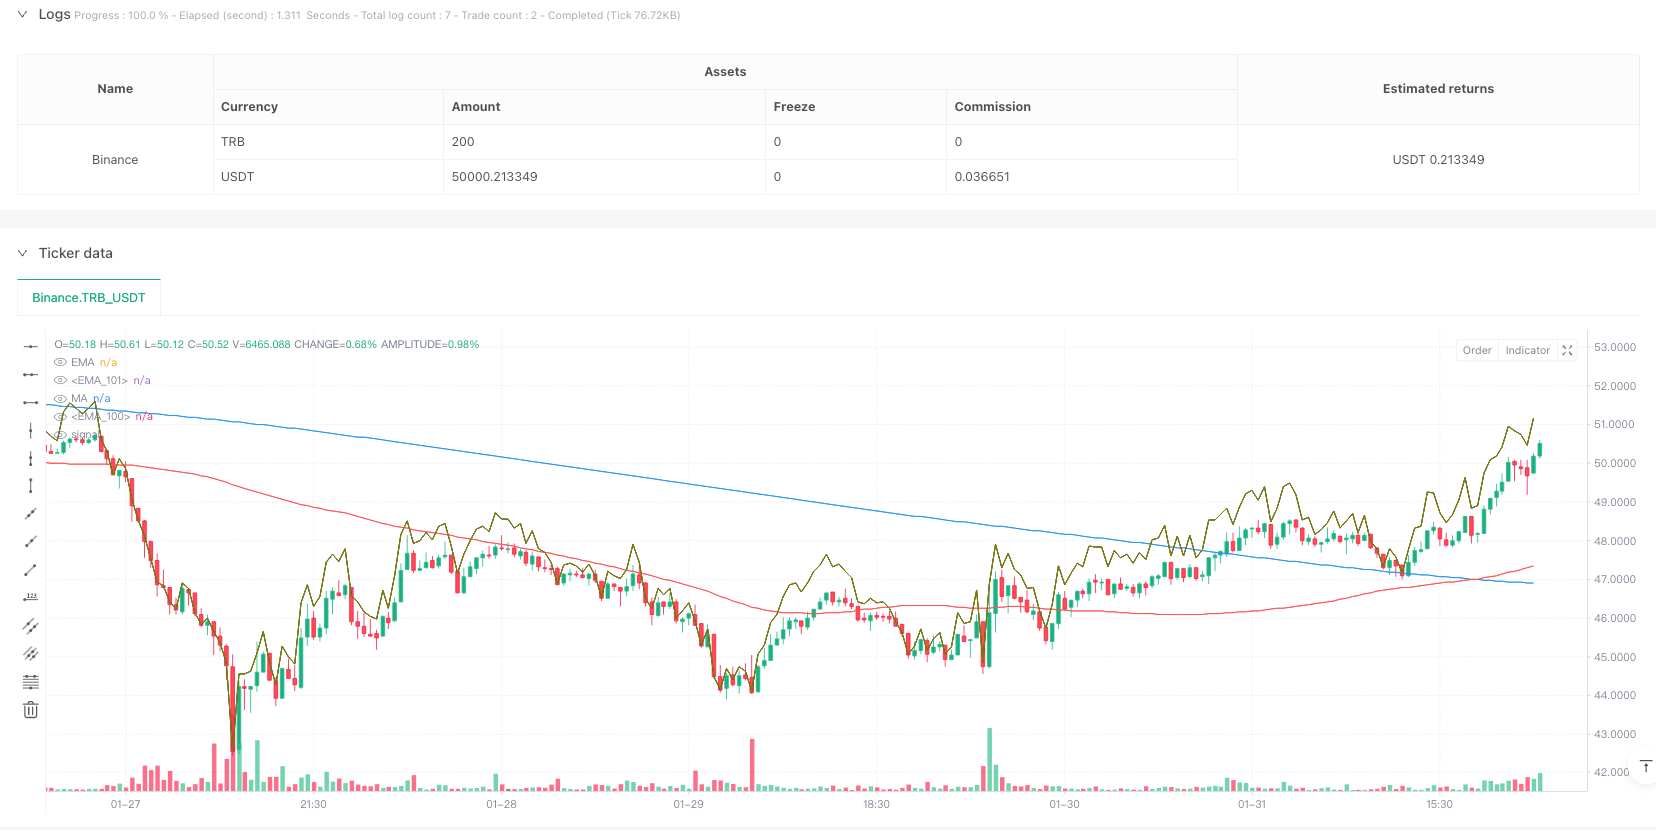
该策略是一个结合了多重技术指标的趋势跟踪交易系统。它主要基于简单移动平均线(SMA)和指数移动平均线(EMA)的交叉信号,并集成了赫尔移动平均线(HMA)趋势带、威廉指标(%R)、摆动高低点分析等多个先进特征,通过动态过滤机制来提供更可靠的交易信号。
策略原理
策略的核心逻辑建立在以下几个关键要素之上: 1. 使用周期为100的SMA和周期为200的EMA作为主要趋势判断指标 2. 整合70周期的HMA趋势带用于确认趋势动量 3. 采用威廉指标(%R)进行动态支撑/阻力位的计算 4. 通过20个周期的回溯窗口检测摆动高低点 5. 实时监控和更新日内高低点 6. 设置开盘初期过滤和波动率阈值(0.5%)来降低虚假信号
入场条件需同时满足:价格站上双均线、%R指标连续3根K线上升且大于-20、K线收阳且收盘价高于前一根、价格未超过日内波动阈值。 出场条件满足以下任一条件:价格跌破双均线、%R指标低于-80。
策略优势
- 多重技术指标的协同验证提高了交易信号的可靠性
- 动态过滤机制有效减少了波动剧烈时期的虚假信号
- 自适应的支撑阻力位计算使策略具有良好的市场适应性
- 完整的日内交易管理机制,包括开盘初期过滤和波动阈值控制
- 参数可调性强,便于根据不同市场条件进行优化
策略风险
- 均线系统在震荡市场可能产生频繁的假信号
- 多重条件的筛选可能导致错过一些潜在的交易机会
- 固定的移动平均线周期可能在不同市场环境下表现不一
- 日内交易过滤机制可能在急速趋势行情中错过重要机会
- 参数优化过度可能导致过拟合问题
策略优化方向
- 引入自适应的均线周期计算机制,使系统能更好地适应市场波动
- 增加成交量分析指标来提高趋势确认的可靠性
- 开发动态的止损止盈机制,提高资金管理的效率
- 加入市场波动率指标,优化过滤条件的阈值设置
- 考虑在不同时间周期的信号协同,增强系统的稳定性
总结
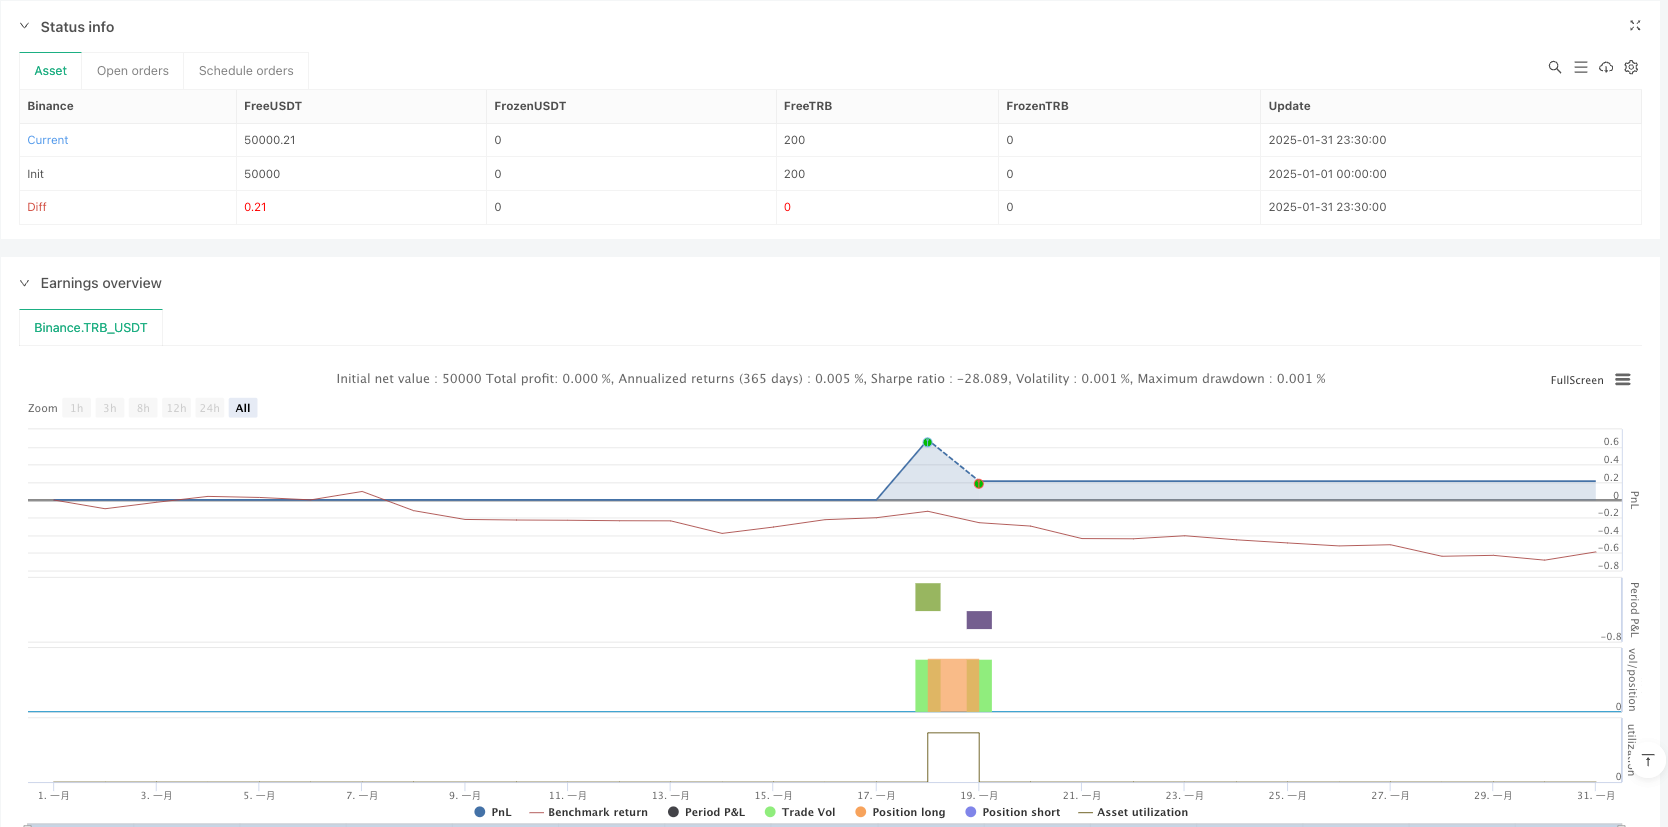
这是一个设计完善的趋势跟踪交易系统,通过多重技术指标的配合和严格的过滤机制,在保证可靠性的同时也保持了较好的灵活性。策略的优化空间主要在于参数的自适应性和风险管理机制的完善。建议交易者在实盘使用前,充分测试不同市场环境下的表现,并根据具体情况调整参数设置。
策略源码
/*backtest
start: 2025-01-01 00:00:00
end: 2025-01-31 23:59:59
period: 30m
basePeriod: 30m
exchanges: [{"eid":"Binance","currency":"TRB_USDT"}]
*/

//@version=5
strategy(title="EMA & MA Crossover Strategy", shorttitle="EMA & MA Crossover Strategy", overlay=true)

// Inputs
LengthMA = input.int(100, minval=1, title="MA Length")
LengthEMA = input.int(200, minval=1, title="EMA Length")
swingLookback = input.int(20, title="Swing Lookback")
Lengthhmaribbon = input.int(70, minval=1, title="HMA Ribbon")
// Input for ignoring the first `n` candles of the day
ignore_n_candles = input.int(1, "Ignore First N Candles", minval=0)
// Input for percentage threshold to ignore high run-up candles
run_up_threshold = input.float(0.5, "Run-up Threshold (%)", minval=0.0)

//====================================================================
hmacondition = ta.hma(close,Lengthhmaribbon)> ta.hma(close,Lengthhmaribbon)[1]

//====================================================================
// Function to drop the first `n` candles
dropn(src, n) =>
    na(src[n]) ? na : src

// Request data with the first `n` candles dropped
valid_candle = not na(dropn(close, ignore_n_candles))
// Check for run-up condition on the previous candle
prev_run_up = (high[1] - low[1]) / low[1] * 100

// Combine conditions: exclude invalid candles and ignore high run-up candles
valid_entry_condition = valid_candle and prev_run_up <= run_up_threshold

//======================================================
// Define the start of a new day based on time
var is_first = false
var float day_high = na
var float day_low = na

// Use time() to detect the start of a new day
t = time("1440") // 1440 = 60 * 24 (one full day in minutes)
is_first := na(t[1]) and not na(t) or t[1] < t

if is_first and barstate.isnew
    day_high := high
    day_low := low
else
    day_high := nz(day_high[1], high)
    day_low := nz(day_low[1], low)

// Update daily high and low
if high > day_high
    day_high := high

if low < day_low
    day_low := low

//====================================================
previousdayclose = request.security(syminfo.tickerid, "D", close)

day_highrange = previousdayclose*.018
//======================================================
length = input(title="Length", defval=14)
src = input(close, "Source")
_pr(length) =>
	max = ta.highest(length)
	min = ta.lowest(length)
	100 * (src - max) / (max - min)
percentR = _pr(length)

//======================================================
higherline = close* 1+((100-(percentR*-1))/100)
lowerline = close* 1-((100-(percentR*-1))/100)
//======================================================
// Moving Averages
xMA = ta.sma(close, LengthMA)
xEMA = ta.sma(xMA, LengthEMA)

// Plot the MA and EMA lines
plot(xMA, color=color.red, title="MA")
plot(xEMA, color=color.blue, title="EMA")

// Find recent swing high and low
recentHigh = ta.highest(high, swingLookback)
recentLow = ta.lowest(low, swingLookback)
//===============================================
emacondition = ta.ema(close,20)>ta.ema(close,30) and ta.ema(close,30)>ta.ema(close,40) and ta.ema(close,40)>ta.ema(close,50) and close >ta.ema(close,20)
// Define Buy Condition
buyCondition1 = (percentR>percentR[1] and percentR[1]>percentR[2] and percentR[2]>percentR[3]) and percentR>-20 and percentR[1]>-20
buyCondition = (close> xMA and close> xEMA) and (close > open and close > close[1]) or xMA>xEMA and close<day_highrange and hmacondition and emacondition

// Define Sell Conditions
sellCondition = (close < xMA and close < xEMA) or xMA<xEMA or percentR<-80

// Strategy Execution
if (buyCondition and buyCondition1 and valid_entry_condition)
    strategy.entry("Buy", strategy.long)

if (sellCondition)
    strategy.close("Buy")  // Close the long position

// Candle coloring for buy/sell indication
barcolor(buyCondition ? color.green : sellCondition ? color.red : na)
plot(higherline, color=color.olive, title="EMA")
plot(higherline, color=color.black, title="EMA")
相关推荐