
2
关注
502
关注者
概述
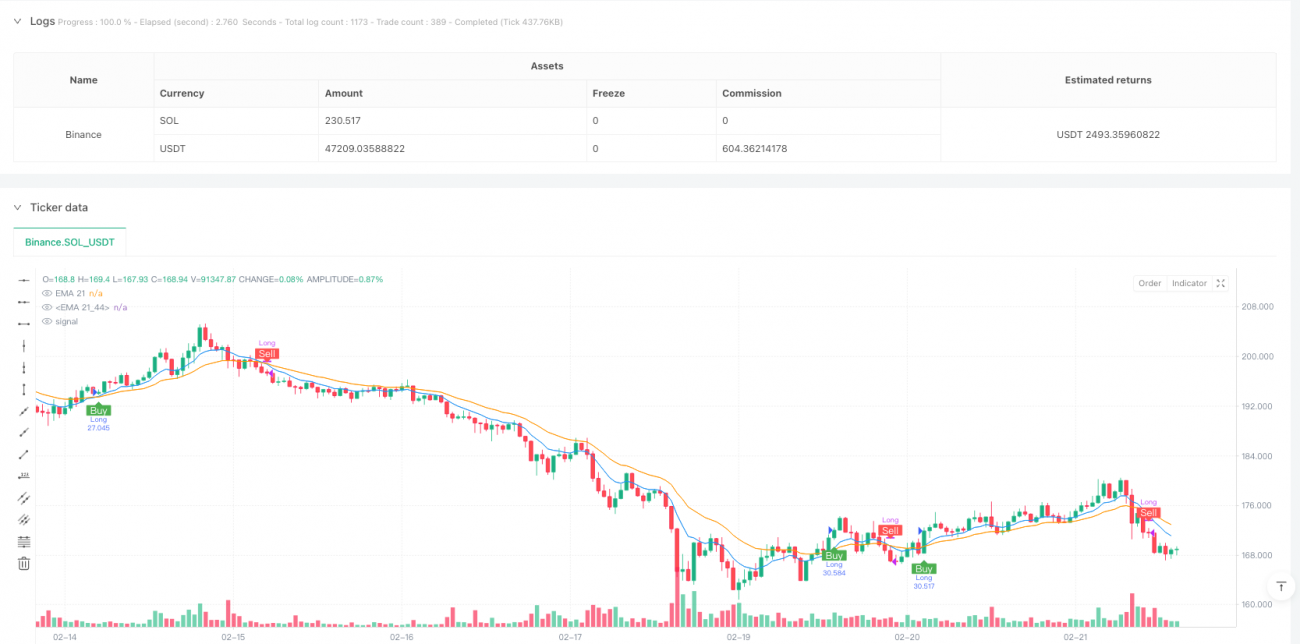
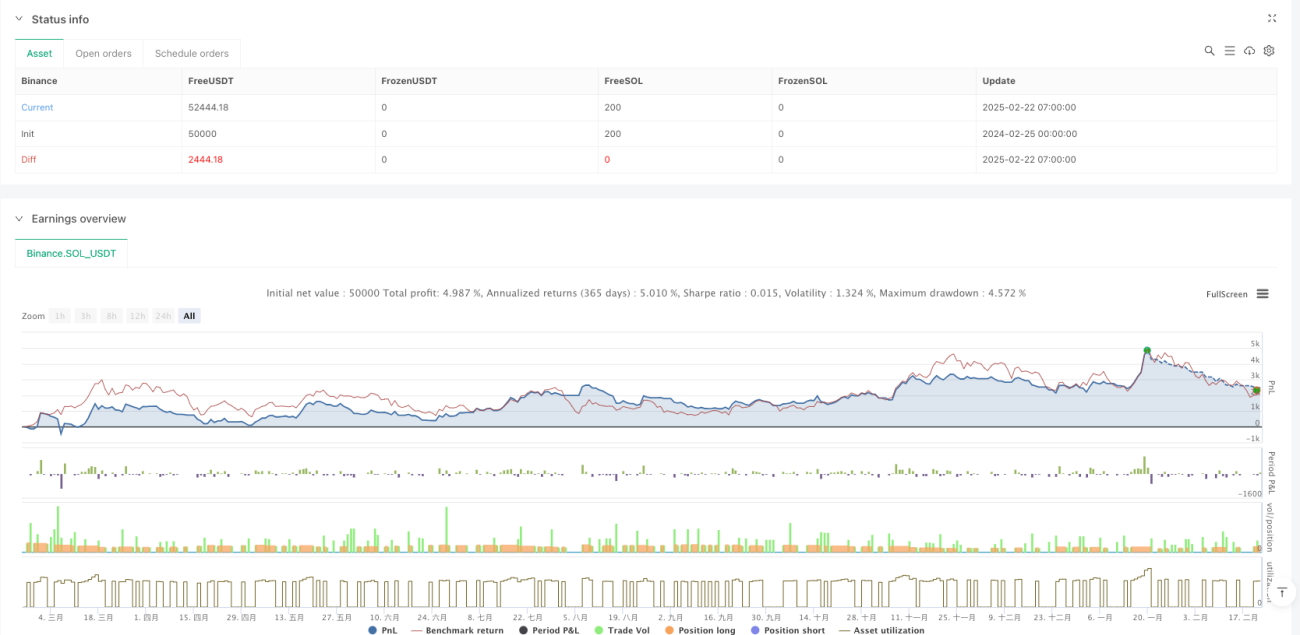
该策略是一个基于双均线交叉的交易系统,通过监控9周期和21周期指数移动平均线(EMA)的交叉情况来进行交易。策略在10分钟时间框架内运行,采用单次交易模式,即在持有仓位时不会重复开仓。系统使用初始资金10万,每次交易使用账户权益的10%进行操作。
策略原理
策略的核心原理是利用短周期EMA对市场价格变化的敏感性高于长周期EMA的特性。当短周期EMA(9周期)向上穿越长周期EMA(21周期)时,表明短期上涨动能增强,系统发出做多信号;当短周期EMA向下穿越长周期EMA时,表明短期下跌动能增强,系统发出平仓信号。策略通过position_size参数确保同一时间只持有一笔交易,有效控制风险。
策略优势
- 信号明确性:使用EMA交叉作为交易信号,判断标准客观清晰,避免主观干扰。
- 风险控制:采用单次交易模式,避免重复建仓带来的风险叠加。
- 资金管理:使用账户权益百分比进行仓位管理,随着账户盈亏动态调整交易规模。
- 可视化支持:系统提供交易信号标签和均线走势图表,便于交易者直观判断。
- 实时提醒:集成了交易信号提醒功能,确保交易者不错过重要交易机会。
策略风险
- 震荡市风险:在横盘震荡市场中,频繁的均线交叉可能导致多次假突破。
- 滞后性风险:EMA本质上是滞后指标,在快速行情中可能错过最佳入场点。
- 单一维度:仅依赖均线交叉可能忽视其他重要的市场信息。
- 固定周期风险:10分钟时间框架可能不适用于所有市场环境。
策略优化方向
- 多维度验证:建议增加成交量、波动率等辅助指标,提高信号可靠性。
- 动态参数:可将EMA周期设置为动态参数,根据市场波动情况自适应调整。
- 仓位管理:可引入更复杂的仓位管理系统,如基于波动率的动态调整。
- 市场环境识别:增加市场环境识别模块,在不同市场条件下采用不同的交易参数。
- 止损优化:加入动态止损机制,提高风险控制的灵活性。
总结
这是一个设计合理、逻辑清晰的均线交叉策略。通过EMA交叉捕捉市场趋势,配合单次交易模式和百分比仓位管理,实现了风险和收益的平衡。尽管存在一些固有的局限性,但通过建议的优化方向,策略的稳定性和适应性都可以得到进一步提升。在实际应用中,建议交易者根据具体市场特点和个人风险偏好进行相应调整。
策略源码
Pine
/*backtest
start: 2024-02-25 00:00:00
end: 2025-02-22 08:00:00
period: 1h
basePeriod: 1h
exchanges: [{"eid":"Binance","currency":"SOL_USDT"}]
*/

//@version=6
strategy("EMA Crossover Labels (One Trade at a Time)", overlay=true, initial_capital=100000, default_qty_type=strategy.percent_of_equity, default_qty_value=10)

// ==== User Inputs ====策略参数
评论
全部评论 (0)
暂无数据
- 1