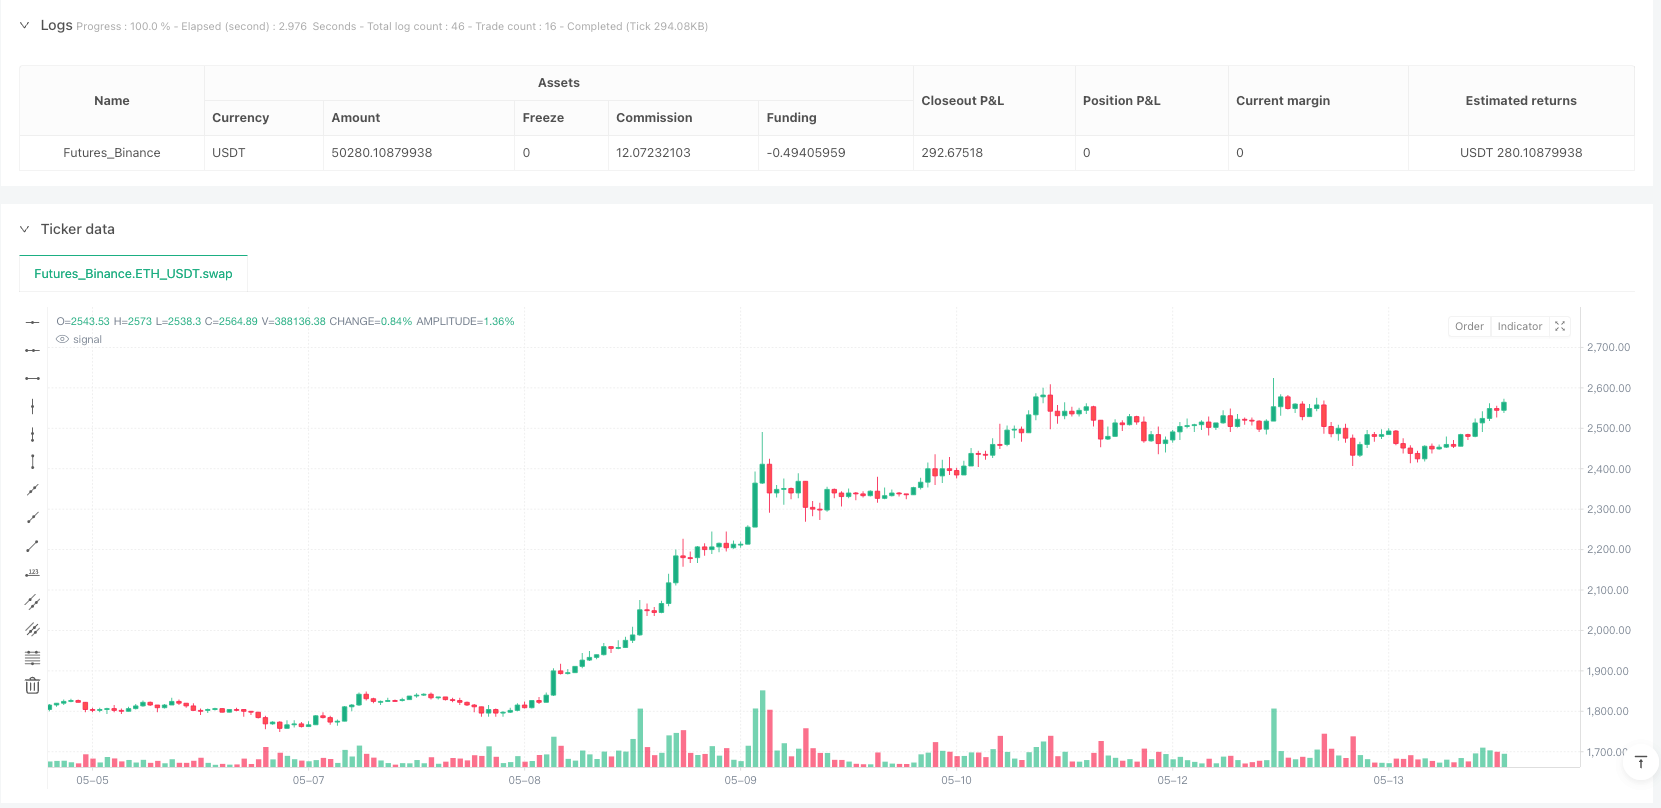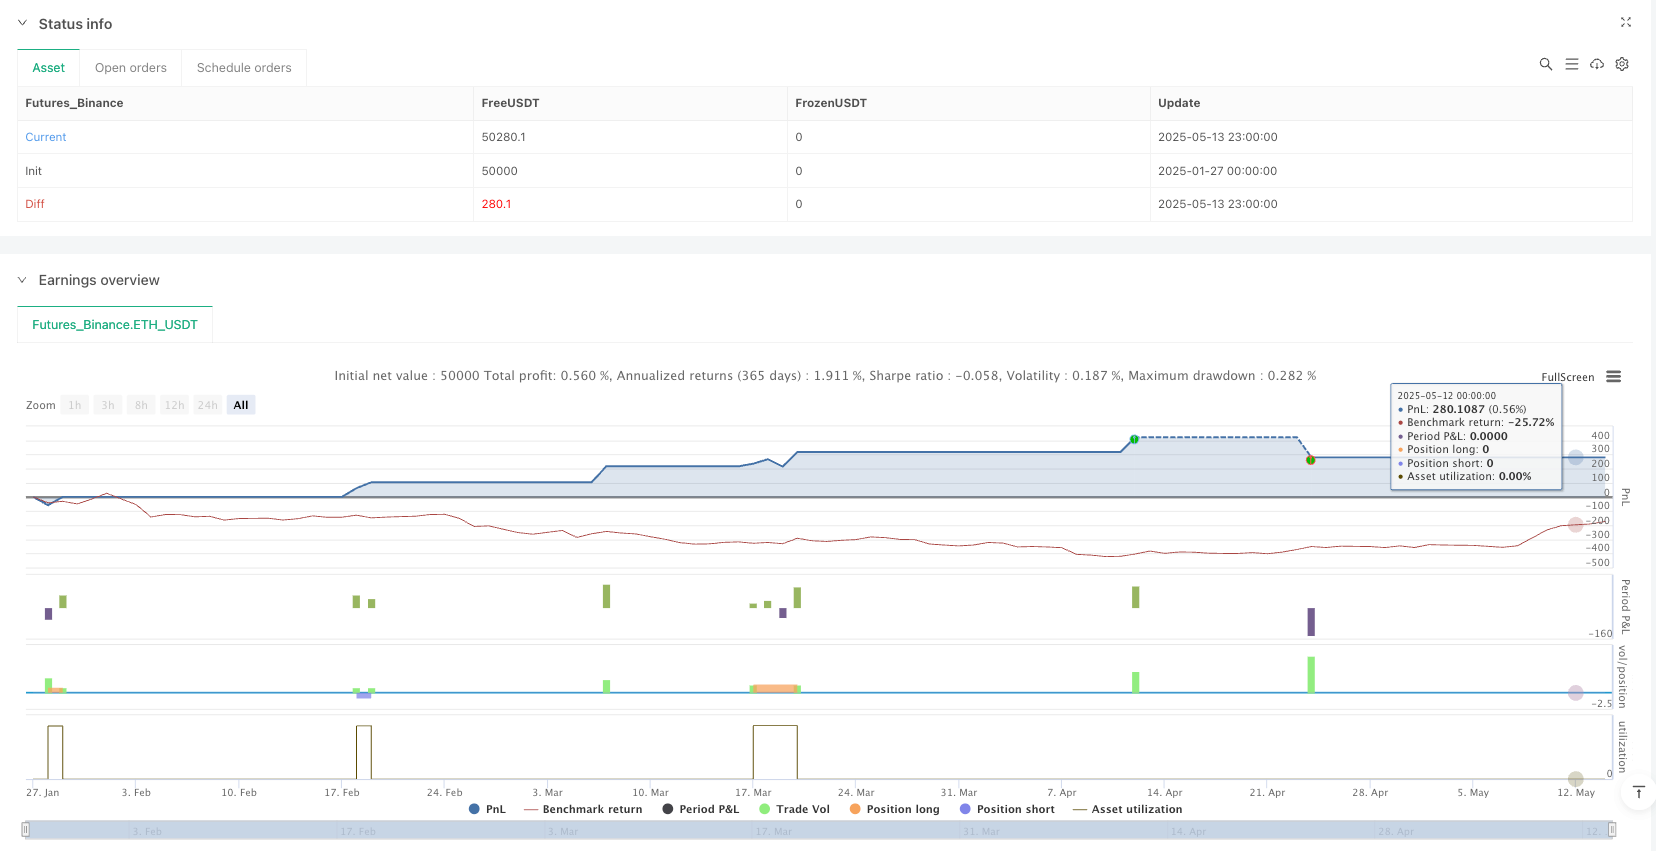

概述
本策略是一套综合性的技术分析交易系统,通过整合多重指标来识别高概率的波段交易机会。该系统主要基于SuperTrend指标作为趋势方向过滤器,结合ADX(平均方向指数)来确认趋势强度,并利用流动性三角洲(Liquidity Delta)分析买卖压力不平衡,从而在多种市场环境中精确生成入场和出场信号。该策略采用了保守的风险管理方法,设置了固定比例的止损(默认2%)和止盈(默认4%),以确保良好的风险回报比率。该系统设计用于加密货币、外汇或股票指数的日线级别波段交易,特别适合于具有明确趋势行为和充分波动性的资产。
策略原理
该策略通过以下四个核心指标的协同工作来形成交易信号:
SuperTrend指标:作为主要的趋势方向过滤器,采用了优化设置(因子:3.0,ATR周期:10)来平衡响应性和可靠性。当价格位于SuperTrend线上方时,识别为上升趋势;当价格位于SuperTrend线下方时,识别为下降趋势。
ADX指标:用于确认当前趋势的强度,过滤掉横盘或混乱的市场环境。策略采用自定义实现方式,计算真实波幅、正向和负向方向移动,最终生成ADX值。当ADX值高于设定阈值(默认25)时,表明存在强劲趋势,系统会更倾向于产生交易信号。
流动性三角洲指标:分析成交量买卖压力不平衡情况,计算出买盘量和卖盘量,并通过一系列标准化和平滑处理获得最终的三角洲值。当三角洲值超过正阈值时产生做多信号,低于负阈值时产生做空信号,以此验证趋势方向和潜在反转。
PSAR指标(可选):可作为趋势变化的额外确认,默认关闭以减少信号过滤。当价格高于PSAR点时,被视为上升趋势;当价格低于PSAR点时,被视为下降趋势。
交易逻辑通过组合所有激活的指标生成综合信号。当所有指标都指向同一方向时,才会产生最终的买入或卖出信号。例如,只有当PSAR条件、SuperTrend条件、ADX条件和流动性三角洲条件都满足做多要求时,系统才会生成买入信号。此外,策略允许用户选择交易方向(仅做多、仅做空或双向交易),以适应不同的市场环境或账户限制。
策略优势
该策略具有以下几个显著优势:
多维度确认系统:通过整合不同类型的技术指标,从趋势、强度和成交量多个维度进行交易确认,显著降低了假信号风险,提高了交易准确性。
适应性强:策略允许用户灵活选择交易方向和启用/禁用特定指标,使系统能够适应各种市场条件和不同交易品种。
严格的风险控制:内置固定比例的止损和止盈机制,确保每笔交易都有预定义的风险限制和盈利目标,有效保护资金安全。
考虑现实交易成本:策略模型中包含佣金(0.035%)和滑点(2点)计算,使回测结果更加符合真实交易环境。
可视化交易信号:提供清晰的买入/卖出信号箭头,具有可自定义大小,便于在图表上快速识别。
信息面板:动态显示当前活跃的指标和风险设置,提供策略运行状态的即时反馈。
保守的仓位管理:默认使用5%的权益作为每笔交易的仓位大小,避免因过度交易导致的资金损失。
策略风险
尽管该策略设计全面,但仍存在以下潜在风险:
参数敏感性:策略性能高度依赖于指标参数设置,特别是SuperTrend因子和ADX阈值,不同市场环境可能需要不同的参数优化,否则可能导致过度交易或错过重要机会。
滞后性风险:由于使用了多个移动平均类指标,信号可能出现一定滞后,导致在快速反转市场中入场或出场不够及时。
相关性风险:多个技术指标之间可能存在内在相关性,这意味着看似独立的确认可能来自基于相似数学模型的指标,降低了多重确认的实际价值。
过度优化风险:在2021-2033年的回测期间表现良好并不一定意味着在未来市场中同样有效,特别是如果这些参数是针对历史数据过度优化的结果。
解决方法: - 定期重新评估和调整指标参数,确保它们仍然适用于当前市场环境 - 考虑增加基于不同原理的指标,如情绪指标或基本面指标,减少技术指标之间的相关性 - 实施动态止损策略,如跟踪止损,以更好地适应市场波动 - 在小资金上进行实盘测试,逐步验证策略在不同市场条件下的表现
策略优化方向
该策略可以通过以下几个方面进行优化:
动态参数调整:实现基于市场波动性自动调整SuperTrend因子和ADX阈值的机制,使策略能够更好地适应不同的市场环境。例如,在低波动市场中使用较小的SuperTrend因子,在高波动市场中使用较大的因子。
时间过滤器:增加基于时间的过滤机制,避免在已知的低流动性或高波动时段交易,如加密货币市场的周末或外汇市场的重要经济数据发布时段。
多时间框架分析:整合更高时间框架的趋势确认,例如,只在日线趋势方向与当前交易时间框架一致时才进入交易。这可以显著提高策略的胜率。
智能止损策略:替换固定比例止损为基于ATR或支撑/阻力位的动态止损,更好地反映市场实际波动状况,减少被市场噪音触发的止损。
增加入场过滤条件:可考虑加入RSI超买超卖判断或布林带边界测试等过滤条件,只在更有利的价格水平入场,提高入场质量。
资金管理优化:实现基于当前策略表现和市场状况的动态仓位管理,在策略表现良好时逐步增加仓位,在不确定性增加时减少仓位。
机器学习增强:利用机器学习技术优化指标权重分配,根据不同市场环境自动调整各指标在最终信号形成中的重要性。
总结
多指标动态趋势交易策略通过整合SuperTrend、ADX和流动性三角洲等多个技术指标,构建了一个全面而灵活的交易系统,适用于各种市场环境中的波段交易。该策略的核心优势在于其多维度的信号确认机制和严格的风险管理框架,能够有效过滤市场噪音并保护交易资金。然而,用户需要注意参数敏感性和指标滞后等潜在风险,并定期重新评估策略表现。
通过实施建议的优化方向,如动态参数调整、多时间框架分析和智能止损策略,该系统有潜力进一步提高其盈利能力和稳定性。最终,这一策略为量化交易者提供了一个坚实的框架,可以根据个人风险偏好和市场观点进行定制和扩展。
/*backtest
start: 2025-01-27 00:00:00
end: 2025-05-14 00:00:00
period: 1h
basePeriod: 1h
exchanges: [{"eid":"Futures_Binance","currency":"ETH_USDT"}]
*/

// This Pine Script® code is subject to the terms of the Mozilla Public License 2.0 at https://mozilla.org/MPL/2.0/
// © TiamatCrypto

//@version=6
// ====================================================================================
// Multi-Indicator Swing Trading Strategy [TIAMATCRYPTO]v6
// ====================================================================================
// DESCRIPTION:
// This strategy uses a combination of technical indicators to identify swing trading
// opportunities in various markets. The default settings are optimized for daily
// timeframes on cryptocurrency and forex markets.
//
// RECOMMENDED DEFAULT SETTINGS:
// - Trading direction: Both (performs well in trending and ranging markets)
// - Position size: 5% (conservative position sizing to manage risk)
// - Stop Loss: 2% (conservative risk management for capital preservation)
// - Take Profit: 4% (realistic profit target with 1:2 risk-reward ratio)
// - Initial capital: $10,000 (realistic starting account size)
// - Timeframe: 2m (best performance on 2m charts)
// - Testing period: 2021-2033 (provides sufficient sample size of trades)
// ====================================================================================

strategy("Multi-Indicator Swing [TIAMATCRYPTO]v6", overlay=true,
     default_qty_type=strategy.percent_of_equity, default_qty_value=5,
     initial_capital=10000, commission_type=strategy.commission.percent,
     commission_value=0.035, slippage=2)

// === BASIC SETTINGS ===
// Backtesting time period set directly in the code for realistic testing
var startDateInput = timestamp("2021-01-01T00:00:00")
var endDateInput = timestamp("2033-12-31T23:59:59")
var inDateRange = time >= startDateInput and time <= endDateInput

// Trading direction settings
tradeDirection = input.string("Both", "Trading Direction", options=["Long Only", "Short Only", "Both"], group="Basic Settings")

// === INDICATOR SWITCHES ===
// PSAR is now disabled by default
usePSAR = input.bool(false, "Use PSAR", group="Indicator Switches")
useSupertrend = input.bool(true, "Use Supertrend", group="Indicator Switches")
useADX = input.bool(true, "Use ADX", group="Indicator Switches")
useLiquidityDelta = input.bool(true, "Use Liquidity Delta", group="Indicator Switches")

// === INDICATOR SETTINGS SECTION ===
// PSAR Settings
// Default PSAR settings are conservative and work well across multiple markets
psarStart = input.float(0.02, "PSAR Initial Value", minval=0.01, maxval=0.1, step=0.01, group="PSAR Settings")
psarIncrement = input.float(0.02, "PSAR Increment", minval=0.01, maxval=0.1, step=0.01, group="PSAR Settings")
psarMaximum = input.float(0.2, "PSAR Maximum", minval=0.1, maxval=0.5, step=0.05, group="PSAR Settings")

// Supertrend Settings
// Factor 3.0 provides a good balance between sensitivity and false signals
atrPeriod = input.int(10, "SuperTrend ATR Period", minval=1, maxval=50, group="SuperTrend Settings")
factor = input.float(3.0, "SuperTrend Multiplier", minval=1, maxval=10, step=0.1, group="SuperTrend Settings")

// ADX Settings
// ADX threshold of 25 is standard for identifying strong trends
adxLength = input.int(14, "ADX Length", minval=1, maxval=50, group="ADX Settings")
adxThreshold = input.int(25, "ADX Trend Strength Threshold", minval=10, maxval=50, group="ADX Settings")

// Liquidity Delta Settings
// These settings help identify significant volume imbalances for trend confirmation
deltaLength = input.int(14, "Liquidity Delta Length", minval=1, maxval=50, group="Liquidity Delta")
deltaSmooth = input.int(3, "Delta Smoothing", minval=1, maxval=20, group="Liquidity Delta")
deltaThreshold = input.float(0.5, "Delta Signal Threshold", minval=0.1, maxval=5, step=0.1, group="Liquidity Delta")

// Risk Management Settings
// Conservative settings to ensure capital preservation
useStopLoss = input.bool(true, "Use Stop Loss", group="Risk Management")
useTakeProfit = input.bool(true, "Use Take Profit", group="Risk Management")
stopLossPercent = input.float(2.0, "Stop Loss (%)", minval=0.5, maxval=5, step=0.1, group="Risk Management")
takeProfitPercent = input.float(4.0, "Take Profit (%)", minval=1.0, maxval=10, step=0.1, group="Risk Management")

// Visualization Settings
signalSize = input.string("Normal", "Signal Size", options=["Small", "Normal", "Large"], group="Visualization")
buyColor = input.color(color.green, "Buy Signal Color", group="Visualization")
sellColor = input.color(color.red, "Sell Signal Color", group="Visualization")

// === INDICATOR CALCULATIONS ===
// All remaining indicators set to initialize as true when their respective switch is off

// PSAR Calculations
psar = ta.sar(psarStart, psarIncrement, psarMaximum)
psarCondition = not usePSAR or (close > psar)
psarSellCondition = not usePSAR or (close < psar)

// Supertrend Calculations
[supertrendValue, supertrendDirection] = ta.supertrend(factor, atrPeriod)
supertrendCondition = not useSupertrend or (supertrendDirection > 0)
supertrendSellCondition = not useSupertrend or (supertrendDirection < 0)

// ADX Calculations - custom implementation
trueRange = math.max(high - low, math.abs(high - close[1]), math.abs(low - close[1]))
smoothedTrueRange = ta.sma(trueRange, adxLength)
dmPlus = high > high[1] ? math.max(high - high[1], 0) : 0
dmMinus = low[1] > low ? math.max(low[1] - low, 0) : 0
smoothedDmPlus = ta.sma(dmPlus, adxLength)
smoothedDmMinus = ta.sma(dmMinus, adxLength)
diPlus = smoothedTrueRange > 0 ? 100 * smoothedDmPlus / smoothedTrueRange : 0
diMinus = smoothedTrueRange > 0 ? 100 * smoothedDmMinus / smoothedTrueRange : 0
dx = (diPlus + diMinus) > 0 ? math.abs(diPlus - diMinus) / (diPlus + diMinus) * 100 : 0
adxValue = ta.sma(dx, adxLength)
adxCondition = not useADX or (adxValue > adxThreshold)

// Liquidity Delta Calculations
bidVolume = close < open ? volume : volume * (high - close) / (high - low + 0.000001)
askVolume = close > open ? volume : volume * (close - low) / (high - low + 0.000001)
deltaRaw = bidVolume - askVolume
deltaAvg = ta.sma(deltaRaw, deltaLength)
deltaNormalized = deltaAvg / ta.sma(volume, deltaLength)
deltaSmoothed = ta.ema(deltaNormalized, deltaSmooth)

// Delta Signals
bullishDelta = deltaSmoothed > deltaThreshold
bearishDelta = deltaSmoothed < -deltaThreshold
deltaCondition = not useLiquidityDelta or bullishDelta
deltaSellCondition = not useLiquidityDelta or bearishDelta

// === TRADING LOGIC ===
// Buy signal - combination of all active indicators
buySignal = psarCondition and supertrendCondition and adxCondition and deltaCondition

// Sell signal - combination of all active indicators
sellSignal = psarSellCondition and supertrendSellCondition and adxCondition and deltaSellCondition

// Apply trading direction
isLongAllowed = tradeDirection == "Long Only" or tradeDirection == "Both"
isShortAllowed = tradeDirection == "Short Only" or tradeDirection == "Both"
finalBuySignal = buySignal and isLongAllowed
finalSellSignal = sellSignal and isShortAllowed

// === POSITION ENTRY WITH RISK MANAGEMENT ===
// Conservative position management with defined risk parameters
if finalBuySignal and inDateRange
    strategy.entry("Long", strategy.long)

    // Conditional setting of stop-loss and take-profit
    if useStopLoss or useTakeProfit
        stopLevel = useStopLoss ? close * (1 - stopLossPercent / 100) : na
        takeProfitLevel = useTakeProfit ? close * (1 + takeProfitPercent / 100) : na
        strategy.exit("Long Exit", "Long", stop=stopLevel, limit=takeProfitLevel)

if finalSellSignal and inDateRange
    strategy.entry("Short", strategy.short)

    // Conditional setting of stop-loss and take-profit
    if useStopLoss or useTakeProfit
        stopLevel = useStopLoss ? close * (1 + stopLossPercent / 100) : na
        takeProfitLevel = useTakeProfit ? close * (1 - takeProfitPercent / 100) : na
        strategy.exit("Short Exit", "Short", stop=stopLevel, limit=takeProfitLevel)

// === SIGNAL VISUALIZATION ===
// Creating separate signals for different sizes
buySmallSignal = finalBuySignal and signalSize == "Small"
buyNormalSignal = finalBuySignal and signalSize == "Normal"
buyLargeSignal = finalBuySignal and signalSize == "Large"

sellSmallSignal = finalSellSignal and signalSize == "Small"
sellNormalSignal = finalSellSignal and signalSize == "Normal"
sellLargeSignal = finalSellSignal and signalSize == "Large"

// Draw signals for each size
plotshape(buySmallSignal and inDateRange, title="Buy Small", location=location.belowbar, color=buyColor, style=shape.triangleup, size=size.small)
plotshape(buyNormalSignal and inDateRange, title="Buy Normal", location=location.belowbar, color=buyColor, style=shape.triangleup, size=size.normal)
plotshape(buyLargeSignal and inDateRange, title="Buy Large", location=location.belowbar, color=buyColor, style=shape.triangleup, size=size.large)

plotshape(sellSmallSignal and inDateRange, title="Sell Small", location=location.abovebar, color=sellColor, style=shape.triangledown, size=size.small)
plotshape(sellNormalSignal and inDateRange, title="Sell Normal", location=location.abovebar, color=sellColor, style=shape.triangledown, size=size.normal)
plotshape(sellLargeSignal and inDateRange, title="Sell Large", location=location.abovebar, color=sellColor, style=shape.triangledown, size=size.large)

// === INFORMATION PANEL ===
// Building list of active indicators
indList = ""
indList := usePSAR ? indList + "PSAR, " : indList
indList := useSupertrend ? indList + "SuperT, " : indList
indList := useADX ? indList + "ADX, " : indList
indList := useLiquidityDelta ? indList + "Delta" : indList

// Remove last comma if it exists
if str.endswith(indList, ", ")
    indList := str.substring(indList, 0, str.length(indList) - 2)

// Building risk management text
riskText = ""
if useStopLoss and useTakeProfit
    riskText := str.tostring(stopLossPercent, "#.#") + "% SL, " + str.tostring(takeProfitPercent, "#.#") + "% TP"
else if useStopLoss
    riskText := str.tostring(stopLossPercent, "#.#") + "% SL"
else if useTakeProfit
    riskText := str.tostring(takeProfitPercent, "#.#") + "% TP"
else
    riskText := "Disabled"

// Display strategy information
var table infoTable = table.new(position.top_right, 2, 5, border_width=1)
table.cell(infoTable, 0, 0, "Strategy:", bgcolor=color.new(color.blue, 90), text_color=color.white)
table.cell(infoTable, 1, 0, "Multi-Indicator Swing", bgcolor=color.new(color.blue, 90), text_color=color.white)
table.cell(infoTable, 0, 1, "Period:", bgcolor=color.new(color.blue, 90), text_color=color.white)
table.cell(infoTable, 1, 1, "2021-2023", bgcolor=color.new(color.blue, 90), text_color=color.white)
table.cell(infoTable, 0, 2, "Direction:", bgcolor=color.new(color.blue, 90), text_color=color.white)
table.cell(infoTable, 1, 2, tradeDirection, bgcolor=color.new(color.blue, 90), text_color=color.white)
table.cell(infoTable, 0, 3, "Indicators:", bgcolor=color.new(color.blue, 90), text_color=color.white)
table.cell(infoTable, 1, 3, indList, bgcolor=color.new(color.blue, 90), text_color=color.white)
table.cell(infoTable, 0, 4, "Risk Management:", bgcolor=color.new(color.blue, 90), text_color=color.white)
table.cell(infoTable, 1, 4, riskText, bgcolor=color.new(color.blue, 90), text_color=color.white)