
8
关注
1370
关注者
在量化交易中,传统的K线图是最常用的数据表现形式之一,但它也存在一定局限性,例如对波动不敏感或过度噪声影响。为了更清晰地观察价格趋势,交易者常常使用一些改进型图表,如:
- 砖图(Renko):基于价格变动而非时间绘制,有效过滤市场噪声。
- 平均K线(Heikin Ashi):通过平滑价格数据,更直观地展示趋势方向。
本文将在 FMZ 量化交易平台上,介绍如何基于普通K线计算出砖图和平均K线数据,并展示绘图效果,帮助策略开发者更直观地分析市场走势。
砖图(Renko)
砖图以“砖块”为单位,只在价格波动超过固定幅度(如 $100)时才画出一个新砖。
- 优势:以价格变动为基础,过滤掉市场中的小幅波动,突出主要趋势。
- 适用场景:适用于识别中长期趋势,减少交易中的噪音干扰。
交易信号解读
- 趋势确认:连续上涨砖块表示趋势强劲,可持仓;出现反向砖块是趋势反转信号。
- 突破交易:当出现新砖块,尤其是打破前高/前低时,可考虑入场。
- 假突破过滤:由于砖图忽略小波动,有助于过滤掉震荡期的小假突破。
核心计算逻辑:
- 设定“砖大小” brickSize
- 以初始价格为基础,不断比较最新价格是否偏离上一个砖价格超过 brickSize
- 如果上涨超出,则画出一个上涨砖块;下跌同理
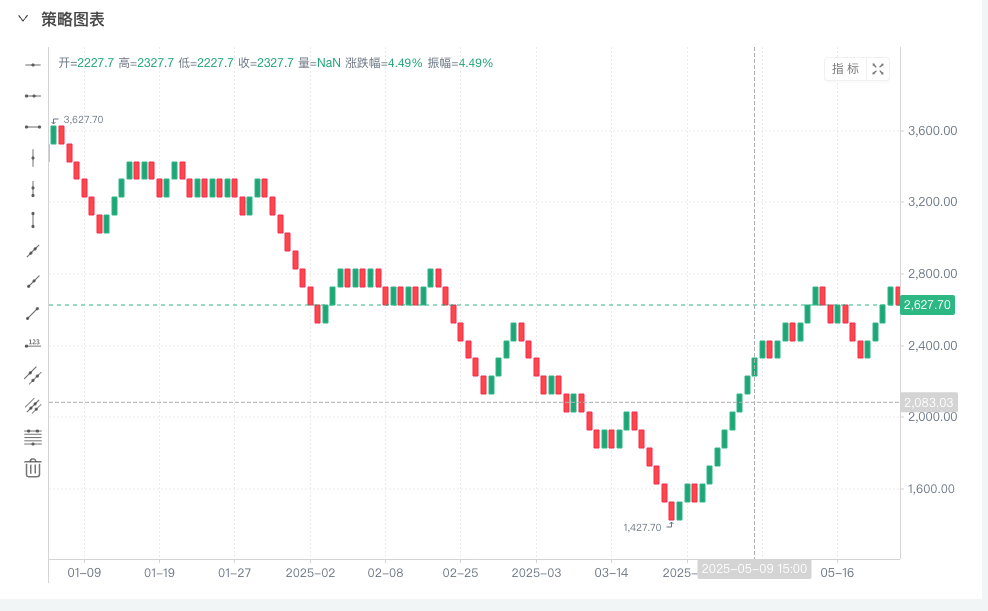
计算砖图(Renko)以及画图实现代码:
javascript
/*backtest
start: 2025-05-01 00:00:00
end: 2025-06-06 00:00:00
period: 1h
basePeriod: 1m
exchanges: [{"eid":"Binance","currency":"ETH_USDT","balance":1000,"stocks":0.5}]
*/
let globalbricks = []
let lastBarTime = 0
function getBricks(r, brickSize, sourceAttribute, lastPrice) {
for (let i = 1; i < r.length; i++) {
let bar = r[i]
let price = bar[sourceAttribute]
let time = bar.Time
if (time < lastBarTime) {
continue
}
// 遍历原始K线数据
while (Math.abs(price - lastPrice) >= brickSize) {
if (globalbricks.length > 0 && time == globalbricks[globalbricks.length - 1].Time) {
time = globalbricks[globalbricks.length - 1].Time + 1000
}
// 构造砖块
let brick = {
Time: time,
Open: lastPrice,
Close: 0,
High: 0,
Low: 0
}
if (price > lastPrice) {
// 上涨砖块
lastPrice += brickSize
brick.Close = lastPrice
brick.High = lastPrice
brick.Low = brick.Open
} else {
// 下跌砖块
lastPrice -= brickSize
brick.Close = lastPrice
brick.High = brick.Open
brick.Low = lastPrice
}
// 放入数组
globalbricks.push(brick)
// time 累加1秒,防止一根BAR分成多块brick时断开
time += 1000
}
lastBarTime = bar.Time
}
return globalbricks
}
function getRenko(r, brickSize, sourceAttribute) {
// 原始K线数据如果不符合计算要求,直接返回
if (!r || r.length <= 0) {
return null
}
if (globalbricks.length == 0) {
return getBricks(r, brickSize, sourceAttribute, r[0][sourceAttribute])
} else {
return getBricks(r, brickSize, sourceAttribute, globalbricks[globalbricks.length - 1].Close)
}
}
function main() {
let c = KLineChart({
overlay: true
})
while (true) {
let r = _C(exchange.GetRecords)
let bricks = getRenko(r, 100, "Close")
bricks.forEach(function (brick, index) {
c.begin(brick)
c.close()
})
Sleep(1000)
}
}
回测测试
平均K线(Heikin Ashi)
Heikin Ashi 是对传统K线的平滑处理
- 优势:通过平滑价格数据,提供更清晰的趋势方向,减少虚假信号。
- 适用场景:适用于趋势跟踪策略,帮助交易者在趋势中持仓更久。
计算方法如下:
            HA_Close = (Open + High + Low + Close) / 4
HA_Open = (前一根 HA_Open + 前一根 HA_Close) / 2
HA_High = max(High, HA_Open, HA_Close)
HA_Low = min(Low, HA_Open, HA_Close)
Heikin Ashi 本质上是一种移动平均滤波的 K 线,具有趋势持续性更强的特点。
趋势判断与信号识别
- 实体较大,几乎无上下影线的阳线 强烈上涨趋势
- 实体较大,几乎无上下影线的阴线 强烈下跌趋势
- 上下影线变长,实体缩小 趋势减弱,警惕反转
- 实体很短,影线较长 市场震荡,暂不操作
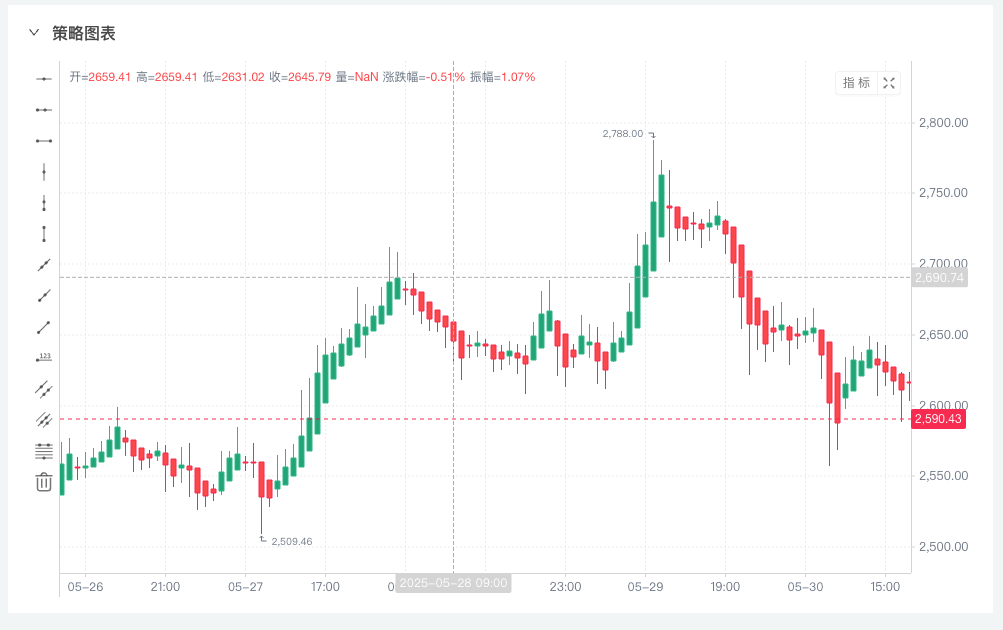
实现代码以及画图:
            javascript

            /*backtest
start: 2025-05-01 00:00:00
end: 2025-06-06 00:00:00
period: 1h
basePeriod: 1h
exchanges: [{"eid":"Binance","currency":"ETH_USDT","balance":1000,"stocks":0.5}]
*/

function toHeikinAshi(records) {
    if (!records || records.length == 0) {
        return null
    }

    let haRecords = []

    for (let i = 0; i < records.length; i++) {
        let r = records[i]
        let ha = {}

        ha.Time = r.Time
        ha.Close = (r.Open + r.High + r.Low + r.Close) / 4

        if (i === 0) {
            // 第一根 Heikin Ashi 的开盘价用普通K线的开盘价和收盘价的均值
            ha.Open = (r.Open + r.Close) / 2
        } else {
            // 后续每根的开盘价 = 上一根Heikin Ashi开盘价和收盘价均值
            ha.Open = (haRecords[i - 1].Open + haRecords[i - 1].Close) / 2
        }

        ha.High = Math.max(r.High, ha.Open, ha.Close)
        ha.Low = Math.min(r.Low, ha.Open, ha.Close)

        haRecords.push(ha)
    }

    return haRecords
}

function main() {
    let c = KLineChart({
        overlay: true
    })

    while (true) {
        let r = _C(exchange.GetRecords)
        let heikinAshiRecords = toHeikinAshi(r)
        heikinAshiRecords.forEach(function (bar, index) {
            c.begin(bar)
            c.close()
        })
        Sleep(1000)
    }
}
回测测试
END
砖图与 Heikin Ashi 是趋势交易者的得力工具:
- 砖图专注价格位移,适合突破与趋势确认。
- Heikin Ashi 注重价格平滑,适合趋势持仓控制。
- 两者互补使用,可提高趋势策略信号的稳定性与抗震荡能力。
建议结合回测与实盘验证,选择适合自身交易品种与周期的图表方案,打造个性化的量化交易系统。
相关推荐
