

一切的开始
做量化交易也有一段时间了,说实话,大部分时候都是在看别人分享的策略,然后拿来改改参数试试。真正从零开始做一个策略的机会不多,主要是没什么好的想法,再加上从想法到代码的距离感觉挺远的。
前段时间闲着没事,又开始刷B站。无意中看到z哥的股票直播,本来就是随便看看,没想到却给了我一个意外的启发。
那个神奇的总结
z哥在讲KDJ指标的时候,评论区有个网友发了一句话,我看了觉得特别有意思:

"小幅下跌钩掉的快,可能后期看涨。大幅下跌勾下的慢,后期还要再跌。小幅上涨沟长得快,可能后期看跌。大幅上涨勾长得慢,后期可能还要再涨。"
当时我就愣了一下,这个总结太精辟了!虽然只是一句话,但感觉把KDJ的J值变化规律说得明明白白的。
我心想,z哥是做股票的,但这个逻辑应该也能用到加密货币上吧?越想越觉得有道理。价格变化的幅度和指标反应的速度,这两个维度结合起来判断后续走势,听起来很有逻辑。而且加密货币市场24小时交易,波动性更大,也许这套理论会有更好的表现。
那一刻我就有点激动了,感觉找到了一个可以探索的方向。但随即又犯愁了,这个想法怎么变成代码呢?以前遇到这种情况,要么就是想想算了,要么就是先放着,等有时间再说。
决定试一试
不过这次不一样,想起发明者平台有AI助手,我想试试能不能直接把这个想法"翻译"成代码。
抱着试试看的心态,我打开了发明者平台的AI助手,把这个想法原封不动地输入进去,还补充了一下:这是应用在股票上的理论,我想用到加密货币上试试看。
没想到AI理解得特别快,很快就给我生成了一套完整的策略代码。那一刻我还挺惊讶的,心想现在的AI这么厉害了?
第一版策略代码:
pine
/*backtest
start: 2024-07-18 09:40:00
end: 2025-06-30 15:00:00
period: 1h
basePeriod: 1h
exchanges: [{"eid":"Binance","currency":"BTC_USDT"}]
*/
//@version=5
strategy("KDJ J值变化速度策略", overlay=false)
// 输入参数 - 针对加密货币市场优化
kdj_length = input.int(14, "KDJ周期", minval=1)
k_smooth = input.int(3, "K平滑", minval=1)
d_smooth = input.int(3, "D平滑", minval=1)
j_speed_period = input.int(5, "J值变化速度计算周期", minval=1)
price_change_threshold = input.float(3.0, "价格变化幅度阈值(%)-区分大小幅", minval=0.1) / 100
j_speed_threshold = input.float(12.0, "J值变化速度阈值-区分快慢", minval=0.1)
j_change_threshold = input.float(1.5, "J值变化忽略阈值-过滤噪音", minval=0.1)
price_change_ignore_threshold = input.float(0.5, "价格变化忽略阈值(%)-过滤噪音", minval=0.01) / 100
// 加密货币风控参数
max_consecutive_trades = input.int(5, "最大连续交易次数", minval=1)
min_bars_between_signals = input.int(3, "信号间最小间隔K线数", minval=1)
enable_stop_loss = input.bool(true, "启用止损")
stop_loss_pct = input.float(5.0, "止损百分比(%)", minval=0.5) / 100
// 计算KDJ指标
highest_high = ta.highest(high, kdj_length)
lowest_low = ta.lowest(low, kdj_length)
rsv = (close - lowest_low) / (highest_high - lowest_low) * 100
k = ta.sma(rsv, k_smooth)
d = ta.sma(k, d_smooth)
j = 3 * k - 2 * d
// 计算J值连续变化速度
// 统计连续上涨或下跌的累计变化量和持续时间
var float j_cumulative_change = 0.0
var int j_consecutive_bars = 0
var int j_direction = 0 // 1为上涨,-1为下跌,0为初始
j_current_change = j - j[1]
// 只有变化幅度超过阈值才认为有方向性
j_current_direction = math.abs(j_current_change) > j_change_threshold ?
(j_current_change > 0 ? 1 : -1) : 0
// 检测J值方向是否改变
if j_current_direction != j_direction and j_current_direction != 0
// 方向改变,重新开始统计
j_cumulative_change := math.abs(j_current_change)
j_consecutive_bars := 1
j_direction := j_current_direction
else if j_current_direction == j_direction and j_current_direction != 0
// 方向相同,累计变化
j_cumulative_change += math.abs(j_current_change)
j_consecutive_bars += 1
else if j_current_direction == 0
// 变化太小忽略,但时间继续累计
j_consecutive_bars += 1
// J值变化速度 = 累计变化量 / 持续时间
j_speed = j_consecutive_bars > 0 ? j_cumulative_change / j_consecutive_bars : 0
// 计算价格连续变化幅度
// 统计连续上涨或下跌的累计变化量和持续时间
var float price_cumulative_change = 0.0
var int price_consecutive_bars = 0
var int price_direction = 0 // 1为上涨,-1为下跌,0为初始
price_current_change = (close - close[1]) / close[1]
// 只有变化幅度超过阈值才认为有方向性
price_current_direction = math.abs(price_current_change) > price_change_ignore_threshold ?
(price_current_change > 0 ? 1 : -1) : 0
// 检测价格方向是否改变
if price_current_direction != price_direction and price_current_direction != 0
// 方向改变,重新开始统计
price_cumulative_change := math.abs(price_current_change)
price_consecutive_bars := 1
price_direction := price_current_direction
else if price_current_direction == price_direction and price_current_direction != 0
// 方向相同,累计变化
price_cumulative_change += math.abs(price_current_change)
price_consecutive_bars += 1
else if price_current_direction == 0
// 变化太小忽略,但时间继续累计
price_consecutive_bars += 1
// 价格变化幅度 = 累计变化量
price_change = price_cumulative_change
// 判断价格变化类型
is_small_change = price_change < price_change_threshold
is_large_change = price_change >= price_change_threshold
// 判断价格方向(基于当前连续变化方向)
is_price_up = price_direction == 1
is_price_down = price_direction == -1
// 判断J值变化速度
is_j_fast = j_speed > j_speed_threshold
is_j_slow = j_speed <= j_speed_threshold
// 交易控制变量
var float entry_price = 0.0
// 策略信号逻辑
// 1. 小幅下跌钩掉的快,可能后期看涨
signal_small_down_fast_j = is_small_change and is_price_down and is_j_fast
// 2. 大幅下跌勾下的慢,后期还要再跌
signal_large_down_slow_j = is_large_change and is_price_down and is_j_slow
// 3. 小幅上涨沟长得快,可能后期看跌
signal_small_up_fast_j = is_small_change and is_price_up and is_j_fast
// 4. 大幅上涨勾长得慢,后期可能还要再涨
signal_large_up_slow_j = is_large_change and is_price_up and is_j_slow
// 交易信号
long_signal = (signal_small_down_fast_j or signal_large_up_slow_j)
short_signal = (signal_small_up_fast_j or signal_large_down_slow_j)
// 执行交易
if long_signal and strategy.position_size == 0
strategy.entry("Long", strategy.long, comment="多头信号开仓")
entry_price := close
if short_signal and strategy.position_size == 0
strategy.entry("Short", strategy.short, comment="空头信号开仓")
entry_price := close
// 平仓条件
// 1. 信号反转平仓
if strategy.position_size > 0 and short_signal
strategy.close("Long", comment="信号反转平多仓")
if strategy.position_size < 0 and long_signal
strategy.close("Short", comment="信号反转平空仓")
// 2. 止损平仓
if enable_stop_loss
if strategy.position_size > 0 and close <= entry_price * (1 - stop_loss_pct)
strategy.close("Long", comment="止损平多仓")
if strategy.position_size < 0 and close >= entry_price * (1 + stop_loss_pct)
strategy.close("Short", comment="止损平空仓")
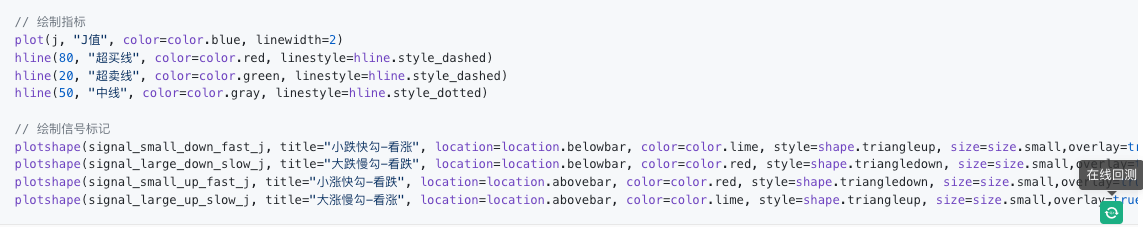
// 绘制指标
plot(j, "J值", color=color.blue, linewidth=2)
hline(80, "超买线", color=color.red, linestyle=hline.style_dashed)
hline(20, "超卖线", color=color.green, linestyle=hline.style_dashed)
hline(50, "中线", color=color.gray, linestyle=hline.style_dotted)
// 绘制信号标记
plotshape(signal_small_down_fast_j, title="小跌快勾-看涨", location=location.belowbar, color=color.lime, style=shape.triangleup, size=size.small,overlay=true)
plotshape(signal_large_down_slow_j, title="大跌慢勾-看跌", location=location.belowbar, color=color.red, style=shape.triangledown, size=size.small,overlay=true)
plotshape(signal_small_up_fast_j, title="小涨快勾-看跌", location=location.abovebar, color=color.red, style=shape.triangledown, size=size.small,overlay=true)
plotshape(signal_large_up_slow_j, title="大涨慢勾-看涨", location=location.abovebar, color=color.lime, style=shape.triangleup, size=size.small,overlay=true)
第一次的兴奋与失落
拿到代码后,我第一件事就是检查能不能运行。发明者平台的编辑器提示没有语法错误,心里先松了一口气。
然后就是最激动人心的时刻了——在线回测。在发明者AI助手页面,产生的页面右下角可以进行实时在线回测。选择回测币种BTC,设置好时间范围,点击在线回测按钮。
结果出来后,心情有点复杂。代码确实能跑,而且逻辑看起来也对,但回测结果并不理想。虽然有盈利的时候,但整体来看胜率不高,而且经常出现连续亏损。
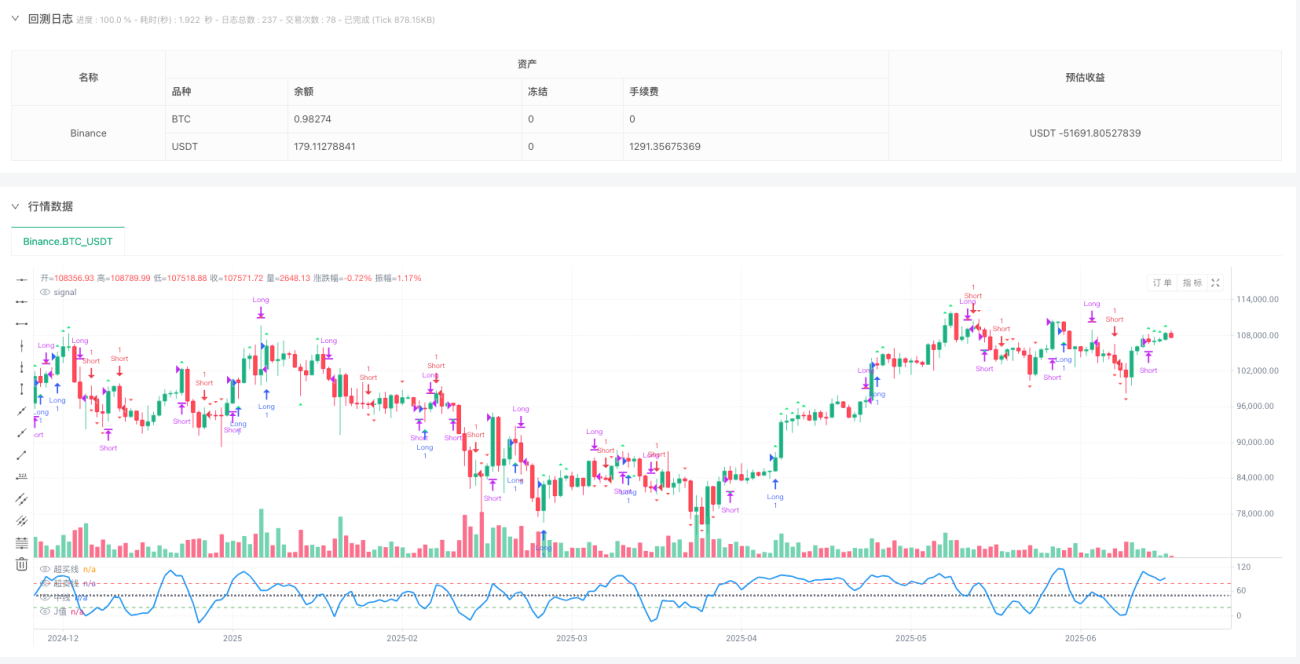
那种感觉就像是,理论上应该能飞的飞机,真的造出来后却飞不起来。有点失落,但又不甘心就这么放弃。
陷入思考
既然理论听起来有道理,代码也能运行,那问题出在哪里呢?
我开始仔细研究代码的逻辑。发现AI写的代码主要是通过计算J值的变化速度来判断"快"和"慢":
            pine

            j_speed = j_cumulative_change / j_consecutive_bars
is_j_fast = j_speed > j_speed_threshold
is_j_slow = j_speed <= j_speed_threshold
乍一看没什么问题,但我总觉得哪里不对劲。
想来想去,突然意识到一个问题:这样计算只是看某一个时刻的变化速度,但没有考虑到变化的连续性。
比如说,J值可能在某一天变化很快,但只是昙花一现,第二天就恢复正常了。这种情况下,用单点的速度来判断可能不太准确。
原来的理论说的是"钩掉的快"、"勾下的慢",这个"快"和"慢"应该是指一个持续的过程,而不是某一个点的状态。
寻找突破
意识到这个问题后,我又有点兴奋了。感觉找到了关键所在,但又不知道怎么改代码。
正好这时候想起之前看到的一些评论,有人提到要注意指标变化的连续性。对啊,连续性!这正是我刚才想到的问题。

我又回到AI助手那里,这次我明确提出了要求:要突出J值变化的连续性,不能只看单点的变化速度,要看连续几天的变化趋势。
AI这次给出的方案让我眼前一亮。它重新设计了整个J值分析的逻辑:
- 不仅记录当前的变化方向,还要跟踪连续变化的天数
- 只有连续几天都在同一个方向变化,才认为是有效的趋势
- 在确认连续性的基础上,再判断变化的快慢
第二版改进后的策略代码:
            pine

            /*backtest
start: 2024-07-18 09:40:00
end: 2025-06-30 15:00:00
period: 1h
basePeriod: 1h
exchanges: [{"eid":"Binance","currency":"BTC_USDT"}]
*/

//@version=5
strategy("KDJ J值连续性变化策略", overlay=false)

// 输入参数
kdj_length = input.int(9, "KDJ周期", minval=1)
k_smooth = input.int(3, "K平滑", minval=1)
d_smooth = input.int(3, "D平滑", minval=1)
j_speed_period = input.int(3, "J值变化速度计算周期", minval=1)
price_change_threshold = input.float(1.5, "价格变化幅度阈值(%)-区分大小幅", minval=0.1) / 100
j_fast_threshold = input.float(15.0, "J值快速变化阈值", minval=1.0)
j_slow_threshold = input.float(5.0, "J值慢速变化阈值", minval=0.1)
j_change_threshold = input.float(1.0, "J值变化忽略阈值-过滤噪音", minval=0.1)
price_change_ignore_threshold = input.float(0.2, "价格变化忽略阈值(%)-过滤噪音", minval=0.01) / 100
min_consecutive_bars = input.int(3, "最小连续K线数", minval=2)

// 风控参数
max_consecutive_trades = input.int(3, "最大连续交易次数", minval=1)
min_bars_between_signals = input.int(5, "信号间最小间隔K线数", minval=1)
enable_stop_loss = input.bool(true, "启用止损")
stop_loss_pct = input.float(3.0, "止损百分比(%)", minval=0.5) / 100

// 计算KDJ指标
highest_high = ta.highest(high, kdj_length)
lowest_low = ta.lowest(low, kdj_length)
rsv = (close - lowest_low) / (highest_high - lowest_low) * 100

k = ta.sma(rsv, k_smooth)
d = ta.sma(k, d_smooth)
j = 3 * k - 2 * d

// 改进的J值连续性变化分析
var float j_cumulative_change = 0.0  // 保持方向性的累计变化(正负数)
var int j_consecutive_bars = 0
var int j_direction = 0  // 1为连续上涨,-1为连续下跌,0为无明确方向
var float j_start_value = 0.0

j_current_change = j - j[1]
// 只有变化幅度超过阈值才认为有方向性
j_current_direction = math.abs(j_current_change) > j_change_threshold ?
                     (j_current_change > 0 ? 1 : -1) : 0

// 重新设计J值连续性检测逻辑
if j_current_direction != 0
    if j_current_direction == j_direction
        // 方向相同,继续累计(保持正负号)
        j_cumulative_change += j_current_change
        j_consecutive_bars += 1
    else
        // 方向改变,重新开始统计
        j_cumulative_change := j_current_change
        j_consecutive_bars := 1
        j_direction := j_current_direction
        j_start_value := j[1]
else
    // 变化很小,视为横盘,重置连续性
    if j_consecutive_bars > 0
        j_consecutive_bars += 1
    else
        j_cumulative_change := 0.0
        j_consecutive_bars := 0
        j_direction := 0

// 计算J值连续性指标(保持方向性)
j_total_change = j - j_start_value  // 从起始点到当前的总变化(带正负号)
j_avg_speed = j_consecutive_bars > 0 ? j_cumulative_change / j_consecutive_bars : 0  // 平均变化速度(带正负号)
j_abs_avg_speed = math.abs(j_avg_speed)  // 变化速度的绝对值

// 新的J值变化判断逻辑
is_j_continuous_up = j_direction == 1 and j_consecutive_bars >= min_consecutive_bars
is_j_continuous_down = j_direction == -1 and j_consecutive_bars >= min_consecutive_bars

// 基于连续性和变化幅度的快慢判断
is_j_fast_up = is_j_continuous_up and j_abs_avg_speed > j_fast_threshold
is_j_slow_up = is_j_continuous_up and j_abs_avg_speed <= j_slow_threshold and j_abs_avg_speed > 0
is_j_fast_down = is_j_continuous_down and j_abs_avg_speed > j_fast_threshold
is_j_slow_down = is_j_continuous_down and j_abs_avg_speed <= j_slow_threshold and j_abs_avg_speed > 0

// 计算价格连续变化幅度(保持原有逻辑)
var float price_cumulative_change = 0.0
var int price_consecutive_bars = 0
var int price_direction = 0

price_current_change = (close - close[1]) / close[1]
price_current_direction = math.abs(price_current_change) > price_change_ignore_threshold ?
                         (price_current_change > 0 ? 1 : -1) : 0

if price_current_direction != price_direction and price_current_direction != 0
    price_cumulative_change := math.abs(price_current_change)
    price_consecutive_bars := 1
    price_direction := price_current_direction
else if price_current_direction == price_direction and price_current_direction != 0
    price_cumulative_change += math.abs(price_current_change)
    price_consecutive_bars += 1
else if price_current_direction == 0
    price_consecutive_bars += 1

price_change = price_cumulative_change

// 判断价格变化类型
is_small_change = price_change < price_change_threshold
is_large_change = price_change >= price_change_threshold
is_price_up = price_direction == 1
is_price_down = price_direction == -1

// 交易控制变量
var float entry_price = 0.0

// 重新设计策略信号逻辑,强调J值的连续性
// 1. 小幅下跌 + J值连续快速下钩 = 看涨(下跌惯性减弱,J值快速回落)
signal_small_down_fast_j_down = is_small_change and is_price_down and is_j_fast_down

// 2. 大幅下跌 + J值连续慢速下钩 = 看跌(下跌惯性仍在,J值缓慢下行)
signal_large_down_slow_j_down = is_large_change and is_price_down and is_j_slow_down

// 3. 小幅上涨 + J值连续快速上钩 = 看跌(上涨惯性减弱,J值快速回落)
signal_small_up_fast_j_up = is_small_change and is_price_up and is_j_fast_up

// 4. 大幅上涨 + J值连续慢速上钩 = 看涨(上涨惯性仍在,J值持续上行)
signal_large_up_slow_j_up = is_large_change and is_price_up and is_j_slow_up

// 交易信号
long_signal = (signal_small_down_fast_j_down or signal_large_up_slow_j_up)
short_signal = (signal_small_up_fast_j_up or signal_large_down_slow_j_down)

// 执行交易
if long_signal and strategy.position_size == 0
    strategy.entry("Long", strategy.long, comment="多头信号开仓")
    entry_price := close

if short_signal and strategy.position_size == 0
    strategy.entry("Short", strategy.short, comment="空头信号开仓")
    entry_price := close

// 平仓条件
if strategy.position_size > 0 and short_signal
    strategy.close("Long", comment="信号反转平多仓")

if strategy.position_size < 0 and long_signal
    strategy.close("Short", comment="信号反转平空仓")

// 止损平仓
if enable_stop_loss
    if strategy.position_size > 0 and close <= entry_price * (1 - stop_loss_pct)
        strategy.close("Long", comment="止损平多仓")

    if strategy.position_size < 0 and close >= entry_price * (1 + stop_loss_pct)
        strategy.close("Short", comment="止损平空仓")

// 绘制指标
plot(j, "J值", color=color.blue, linewidth=2)
hline(80, "超买线", color=color.red, linestyle=hline.style_dashed)
hline(20, "超卖线", color=color.green, linestyle=hline.style_dashed)
hline(50, "中线", color=color.gray, linestyle=hline.style_dotted)

// 在下方子图显示连续性指标
plot(j_consecutive_bars, "连续K线数", color=color.orange)
plot(j_avg_speed, "平均变化速度(带方向)", color=color.purple)
plot(j_abs_avg_speed, "平均变化速度(绝对值)", color=color.yellow)

// 绘制信号标记
plotshape(signal_small_down_fast_j_down, title="小跌+J快速下钩-看涨", location=location.belowbar, color=color.lime, style=shape.triangleup, size=size.small, overlay=true)
plotshape(signal_large_down_slow_j_down, title="大跌+J慢速下钩-看跌", location=location.belowbar, color=color.red, style=shape.triangledown, size=size.small, overlay=true)
plotshape(signal_small_up_fast_j_up, title="小涨+J快速上钩-看跌", location=location.abovebar, color=color.red, style=shape.triangledown, size=size.small, overlay=true)
plotshape(signal_large_up_slow_j_up, title="大涨+J慢速上钩-看涨", location=location.abovebar, color=color.lime, style=shape.triangleup, size=size.small, overlay=true)

// 背景色显示J值连续性状态
bgcolor(is_j_continuous_up ? color.new(color.green, 95) : is_j_continuous_down ? color.new(color.red, 95) : na, title="J值连续性背景")
看到这个改进,我心里有种"就是这个感觉"的兴奋。这下子J值的变化不再是孤立的点,而是连续的趋势了。
第二次回测的惊喜
拿到新代码后,我迫不及待地又做了一次回测。
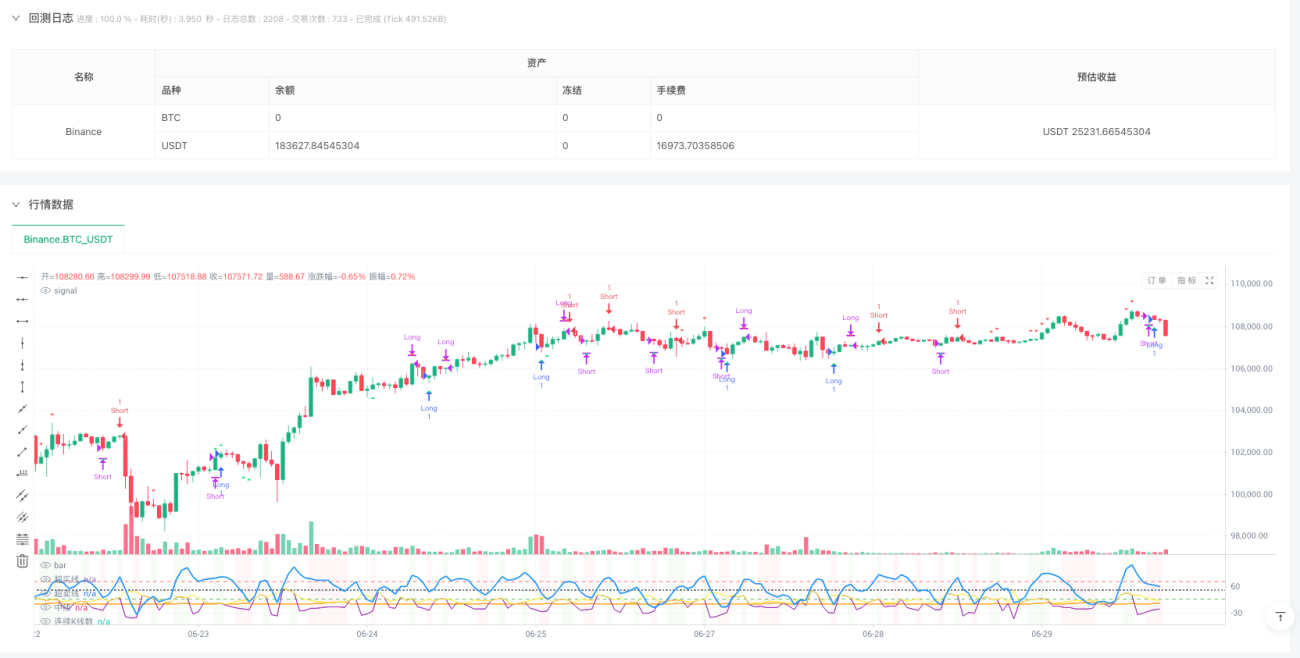
这次的结果让我有点惊喜。虽然不能说是完美的策略,但明显比第一版好了很多:
- 假信号少了很多,因为要求连续性过滤掉了不少噪音
- 胜率有明显提升
- 策略逻辑更加清晰
看着回测报告上的盈利曲线,那种成就感还是挺强的。虽然不是什么惊天动地的策略,但毕竟是从一个想法开始,一步步探索出来的。
工具使用的感受
这次探索让我对AI助手和量化平台有了新的认识。
AI助手的价值:
以前觉得AI就是个弱智能辅助工具,这次才发现它在量化交易中真的很有用。最大的价值不是替代人的思考,而是大大缩短了从想法到代码的距离。
- 理解能力强:我只是用很朴素的语言描述了一个想法,它就能准确理解并转化成完整的策略逻辑
- 迭代速度快:当我提出改进要求时,它能很快定位到问题所在并给出解决方案
- 代码质量不错:生成的代码不仅能运行,而且结构清晰,注释详细
量化平台的便利:
发明者平台的回测功能也让我印象深刻。以前想要回测一个策略,要自己去找历史数据,写回测框架,处理各种技术细节。现在只需要把代码粘贴进去,设置好参数,就能立即看到结果。
这种即时反馈让整个探索过程变得很流畅,想法、代码、验证、改进,形成了一个很快的循环。
一些反思
当然,这次探索也让我想到了一些问题:
AI的局限性:
虽然AI帮了大忙,但它毕竟不是万能的。第一版代码的问题,AI自己是发现不了的,还是需要人来分析和判断。而且AI给出的方案也不一定是最优的,需要结合实际情况来调整。
策略本身的局限:
这个策略虽然在回测中表现不错,但也不是万能的。在震荡行情中表现一般,而且参数需要根据不同币种来调整。
最重要的是,不能因为某个策略在历史数据上表现好,就认为它在未来也一定有效。市场是变化的,策略也需要不断调整。
意外的收获
除了策略本身,这次探索还有一些意外的收获:
对量化交易的认识变了:
以前觉得量化交易门槛很高,需要很强的编程能力和数学基础。这次体验让我觉得,其实想法和逻辑更重要。有了好的工具,技术门槛并没有想象中那么高。
对学习的态度变了:
以前遇到有趣的想法,总是想着"等有时间了再试试",结果往往就不了了之了。这次的经历让我意识到,现在的工具已经让"试试看"变得很容易,关键是要有行动的勇气。
对失败的看法变了:
第一版策略效果不好的时候,我没有马上放弃,而是去分析问题所在。这个过程让我意识到,失败往往不是终点,而是找到正确方向的线索。
后续的打算
现在这个策略还在我的代码库里,偶尔会用用。虽然不是什么完美的策略,但作为一次探索的成果,我还是挺满意的。
更重要的是,这次经历给了我信心。原来从想法到策略,距离并没有想象中那么远。
接下来我想继续这种探索:
- 多关注一些有趣的交易理论和想法
- 试试把其他领域的一些概念应用到交易中
- 继续利用AI和量化平台来快速验证想法
给其他人的建议
如果你也对量化交易感兴趣,我的建议是:
- 不要被技术门槛吓住:现在的工具已经很强大了,重要的是有想法和执行力
- 从小处开始:不需要追求完美的策略,先从简单的想法开始探索
- 勇于试错:第一次不成功很正常,关键是要分析问题并持续改进
- 保持学习的心态:多关注不同的观点和理论,灵感往往来自意想不到的地方
结语
回想起来,这次探索的起点只是B站上的一句评论,但却让我体验了一次完整的量化策略开发过程。
在这个知识和工具都触手可及的时代,也许我们真的只是缺少一次勇敢的尝试。不管你是量化新手还是有经验的交易者,都可以试试从一个简单的想法开始,看看能走到哪里。
说不定下一个有趣的策略,就藏在你刚刚看到的某个评论里。
免责声明:这只是个人探索经历分享,不是投资建议。交易有风险,请谨慎决策。
- 1