
Preface
For domestic users, trading US stocks is indeed quite cumbersome—it requires opening overseas bank accounts, setting up US stock trading accounts, dealing with foreign exchange controls, and a series of other issues. The emergence of RWA tokenized US stocks has changed all this, allowing users to directly trade US stock contracts with cryptocurrency, completely bypassing traditional brokers and eliminating the need for cross-border fund transfers.
Today, we'll attempt to build an AI-automated workflow for RWA US stock trading on the FMZ Quant platform (Inventor Quantitative), letting algorithms analyze the market and make decisions for us, truly realizing the dream of "using technology to harvest Wall Street." But don't get me wrong—this is more of a technical exploration. Automated trading sounds wonderful, but risk management is the core.
What is RWA? Why is it suddenly so popular?
RWA stands for Real World Assets. Simply put, it means representing valuable things from the real world—such as real estate, bonds, stocks, gold—in the form of blockchain tokens. Each token corresponds to a real underlying asset.
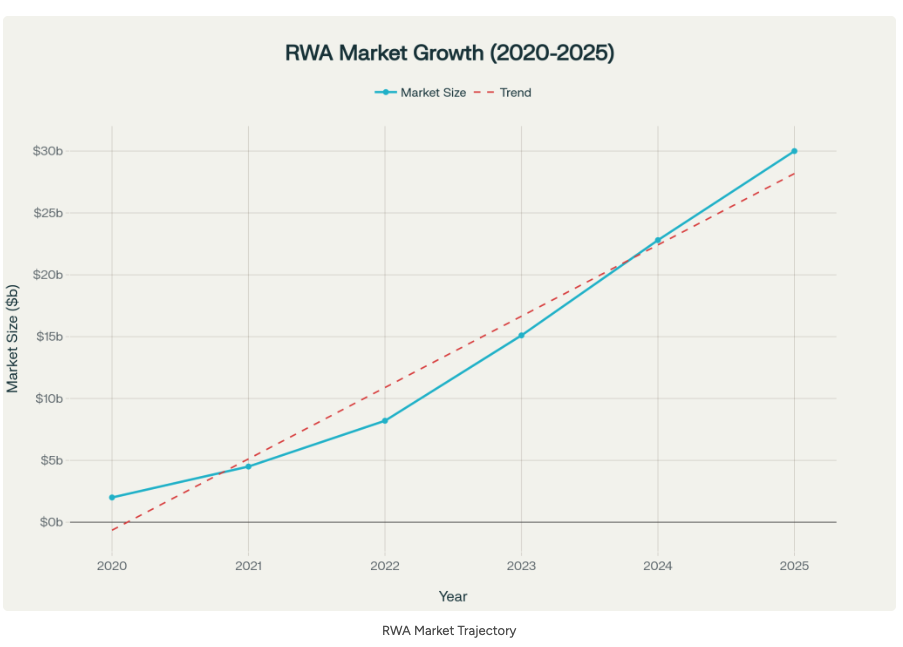
This sector has grown extremely rapidly in 2025, with on-chain asset value reaching $30 billion, a 400% increase compared to three years ago. The entire RWA market has exceeded $230 billion in scale, with stablecoins accounting for the largest share, followed by tokenized US Treasury bonds.
Why is it so popular? The industry consensus is:
- Traditional financial institutions are taking it seriously: Giants like BlackRock and JPMorgan Chase are all expanding their tokenized asset businesses
- Regulations are becoming clearer: Europe's MiCA regulations have already taken effect, and the US GENIUS Act has passed the Senate Banking Committee
- Technology has matured: Blockchain networks are faster, and smart contracts are more reliable
Tokenized US Stocks: A Bridge Between Traditional and Crypto
What are tokenized US stocks?
Tokenized stocks are digital tokens on the blockchain that represent shares of real-world stocks. Each token reflects the value of traditional stocks (such as Tesla or Apple) and is typically backed 1:1 by actual stocks held in custody by regulated institutions.
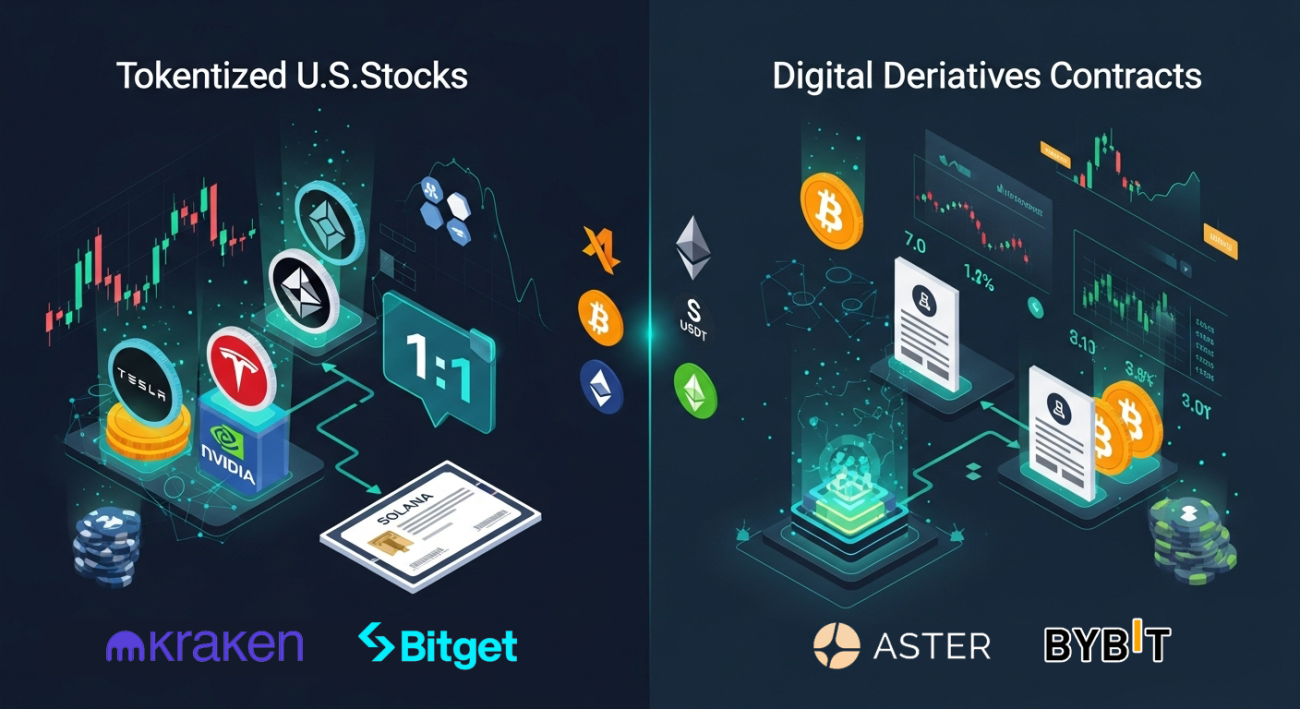
However, it's important to clarify that tokenized US stocks come in two main forms:
- 1、 1:1 backed tokenized stocks: Such as xStocks launched by Kraken and Bybit, where each token is backed by real stocks, issued on the Solana blockchain
- 2、 Perpetual contract form: Such as those provided by Aster and Bitget, which are derivative contracts that don't directly hold stocks but track stock prices and settle in cryptocurrency
Regarding Trading Hours
Most tokenized US stock platforms offer 24/5 trading—that is, five days a week, 24 hours a day, which is much longer than the traditional US stock market's 6.5 hours of trading per day, but it's not yet true 24/7 trading.
Workflow Design Philosophy
The goal of this workflow is to build a complete chain of "data collection → AI analysis → automated trading," allowing AI to automatically make trading decisions based on technical indicators and market sentiment.
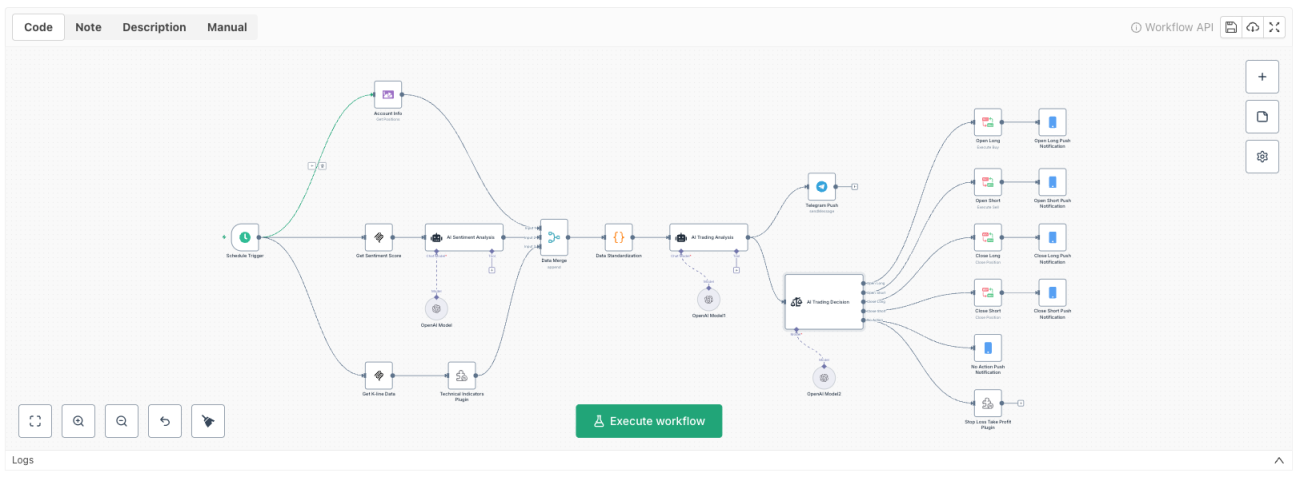
Overall Architecture
text
Scheduled Trigger (Daily at 21:30)
↓
Fetch Three Types of Data (in parallel)
├── Account Position Information
├── Market News Sentiment (Alpha Vantage)
└── Candlestick Technical Data (Alpha Vantage)
↓
Data Processing and Standardization
↓
AI Multi-layer Analysis (Claude Sonnet 4)
├── Sentiment Analysis (short-term + long-term)
├── Technical Analysis (generate report)
└── Trading Decision (5 options)
↓
Execute Operations
├── Open Long/Open Short/Close Long/Close Short/No Action
├── Telegram Notification
└── Take Profit & Stop Loss (3% take profit, 1% stop loss)
Detailed Configuration of Key Nodes
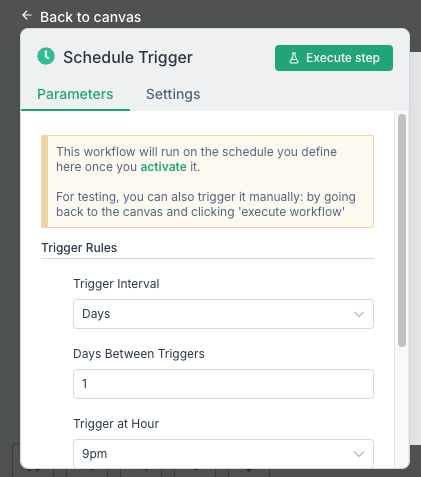
1、Scheduled Trigger
Set to run daily at 21:30 (Beijing Time). This time is chosen because it corresponds to the US stock market opening time in the UTC+8 timezone.
2、Account Information Node
Retrieves the current position status on the exchange.
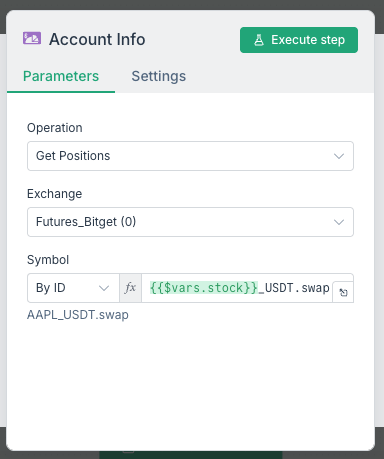
Here, the external variable $vars.stock is used to dynamically specify the stock symbol, for example, "AAPL" represents the Apple stock perpetual contract.
3、Fetch Sentiment Data (Alpha Vantage MCP)
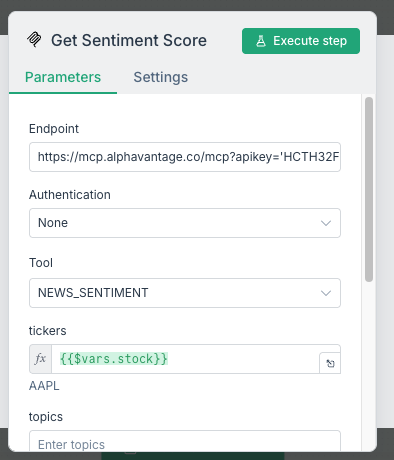
Configuration Parameters:
            text

            Endpoint URL: https://mcp.alphavantage.co/mcp?apikey='YOUR_API_KEY'
Authentication Method: none
Tool: NEWS_SENTIMENT
tickers: {{$vars.stock}}
Required Credentials:
You need an Alpha Vantage API Key. You can apply for free on the Alpha Vantage official website; the free version has daily request limits.
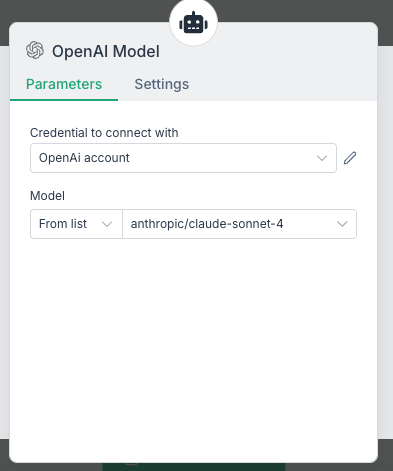
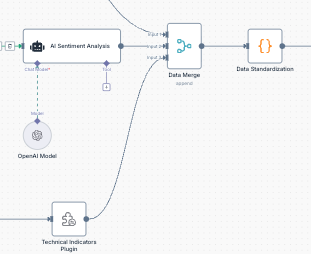
4、AI Sentiment Analysis Node
Based on the sentiment data obtained, use an AI model to analyze market sentiment. Here, you first need to set up the large language model credentials, then select the required model. After successful setup, we can input prompts to have the AI help us with relevant text analysis and trading decisions.
Prompt:
            text

            You are a highly intelligent and precise sentiment analyzer specializing in US stock markets. For the symbol {{$vars.stock}}, analyze text sentiment using a two-part approach:

Short-term Sentiment:
- Assess immediate market reactions, recent news impact, and technical volatility
- Determine sentiment category: "Positive", "Neutral", or "Negative"
- Calculate a score between -1 (extremely negative) and 1 (extremely positive)
- Provide concise reasoning

Long-term Sentiment:

- Evaluate overall market outlook, fundamentals, and macroeconomic factors
- Determine sentiment category and score
- Provide detailed reasoning

Output format (strict JSON, no additional text):
{
  "shortTermSentiment": {
    "category": "Positive",
    "score": 0.7,
    "rationale": "..."
  },
  "longTermSentiment": {
    "category": "Neutral",
    "score": 0.0,
    "rationale": "..."
  }
}

Now, analyze the following text:
{{ $json.text }}
5、Fetch Candlestick Data (Alpha Vantage MCP)
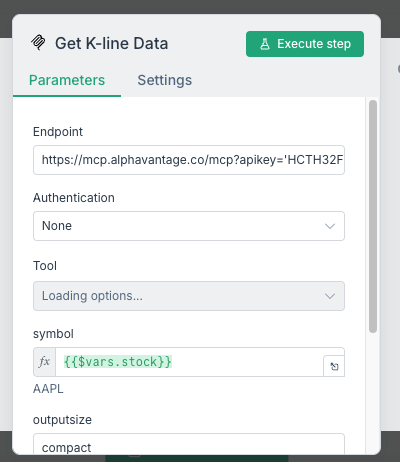
Configuration Parameters:
            text

            Endpoint URL: https://mcp.alphavantage.co/mcp?apikey='YOUR_API_KEY'
Authentication Method: none
Tool: TIME_SERIES_DAILY
symbol: {{$vars.stock}}
outputsize: compact
On Data Source Selection
There's an important design philosophy here: we use actual daily candlestick data from the US stock market, rather than on-chain data from exchanges.
Why do this? There are several key considerations:
- Price Regression Principle: Tokenized US stock prices will ultimately converge toward real US stock prices. Although crypto exchange prices may deviate in the short term due to liquidity, funding rates, and other factors, they will inevitably follow actual stock price trends in the long run.
- More Reliable Data Quality: Alpha Vantage provides official data from mainstream exchanges, which is more accurate and stable compared to emerging decentralized exchanges.
- Technical Indicators Have Greater Reference Value: MACD, RSI, and other technical indicators calculated based on real US stock data reflect the true conditions of mainstream markets. After all, most trading volume and institutional capital are still in traditional markets.
- Avoid Data Anomaly Risks: On-chain data may experience anomalies due to smart contract bugs, oracle failures, etc. (such as the XPL price malfunction incident). Using traditional market data can avoid these types of technical risks.
For beginners, starting with daily data from traditional markets to establish basic strategies is a prudent choice. Once familiar with the entire process, you can gradually incorporate on-chain data and higher-frequency timeframes for optimization.
6、Indicator Calculation Plugin
Based on the completed data retrieval, we use a plugin to calculate specific indicators as technical data reference. This plugin uses JavaScript code to calculate four types of technical indicators. The input parameter is the result from the previous data retrieval step. The FMZ platform's talib function has certain format requirements for input data, so we first perform conversion, then calculate four indicators:
javascript
function main(inputData) {
const records = [];
const lines = inputData.trim().split(/\r?\n/);
// Check if there are more than 10 data rows (excluding header)
if (lines.length - 1 <= 10) {
Log("Error: Data must have more than 10 rows (excluding header)");
return null;
}
// Skip header row and process data
for (let i = 1; i < lines.length; i++) {
const values = lines[i].split(',');
// CSV has 6 columns: timestamp, open, high, low, close, volume
if (values.length >= 6) {
const record = {
Time: new Date(values[0]).getTime(),
Open: parseFloat(values[1]),
High: parseFloat(values[2]),
Low: parseFloat(values[3]),
Close: parseFloat(values[4]),
Volume: parseFloat(values[5]),
OpenInterest: 0
};
records.push(record);
}
}
// Double check parsed records
if (records.length <= 10) {
Log("Error: Successfully parsed data has 10 or fewer records");
return null;
}
// Calculate technical indicators (requires talib library)
const macd = talib.MACD(records);
const rsi = talib.RSI(records, 14);
const atr = talib.ATR(records, 14);
const obv = talib.OBV(records);
// Get last 10 values
function getLast10Values(arr) {
if (!arr || arr.length === 0) return [];
return arr.slice(-10);
}
const result = {
MACD: {
macd: getLast10Values(macd[0]),
signal: getLast10Values(macd[1]),
histogram: getLast10Values(macd[2])
},
RSI: getLast10Values(rsi),
ATR: getLast10Values(atr),
OBV: getLast10Values(obv)
};
Log('Indicator signals calculated successfully')
return result;
}
Why Choose These Four Indicators?
- MACD (Moving Average Convergence Divergence): Determines trend direction and strength; histogram reversal is an important signal
- RSI (Relative Strength Index): Identifies overbought/oversold conditions; >70 is overbought, <30 is oversold
- ATR (Average True Range): Measures market volatility; helps set stop-loss levels
- OBV (On-Balance Volume): Confirms price movement validity through trading volume
These are just demonstrations using four classic indicators. In fact, the FMZ platform includes many more indicator calculation functions, covering almost all mainstream technical analysis methods. If you're not satisfied with these, you can also use custom indicator calculation functions to build additional indicators.
7、Data Standardization Node
After the three data sources are retrieved and merged using an aggregation node, use a Code node to integrate the data from the three sources into a unified format:
            javascript

            let posData = null;
let contentData = null;
let technicalIndicators = null;

for (const item of items) {
    // Extract position data
    if (item.json.operation == 'getPosition' && item.json.result !== undefined) {
        posData = item.json.result;
        posData.amount = posData.amount == 0 ? "No position" :
                         posData.amount > 0 ? "Long position" : "Short position";
    }

    // Extract sentiment analysis results
    if (item.json.output !== undefined) {
        contentData = item.json.output;
    }

    // Extract technical indicators
    if (item.json.MACD !== undefined) {
        technicalIndicators = {
            "Trend Indicator MACD": item.json.MACD,
            "Oscillator RSI": item.json.RSI,
            "Volatility Indicator ATR": item.json.ATR,
            "Volume Analysis OBV": item.json.OBV
        };
    }
}

return [{
    json: {
        "Position Data": posData,
        "Sentiment Analysis": contentData,
        technicalIndicators
    }
}];
8、AI Trading Analysis Node
This is the core node of the entire workflow, responsible for integrating all previously collected data (position status, sentiment analysis, technical indicators) to generate a detailed trading analysis report.
Node Logic Explanation:
This node receives standardized data and performs comprehensive analysis through the Claude Sonnet 4 model, outputting a formatted Telegram HTML report. The key lies in the prompt design—it needs to make the AI understand:
- 1、Position Priority Principle: If the account already has a position, the analysis focus should be on risk management (whether to add/reduce/close positions), rather than simply giving opening recommendations
- 2、Dual Time Dimensions: Provide both short-term (1-7 days) and long-term (1-4 weeks) analysis recommendations, corresponding to different position allocation strategies
- 3、Technical + Sentiment Integration: Analyze objective indicators like MACD and RSI, while also incorporating market sentiment scores for judgment
- 4、Actionability: Must provide specific price levels (entry price, stop-loss price, target price), rather than vague suggestions
Prompt Structure (Simplified Version):
            text

            **Data Structure:**
Position Information + Sentiment Analysis + Technical Indicators

**Analysis Framework:**

- Position status assessment
- Short-term analysis (based on latest 5-10 periods)
- Long-term analysis (based on complete trend)

**Output Requirements:**
Telegram HTML format, including:

- Current position status
- Short-term operation recommendation (30-50% position)
- Long-term investment recommendation (20-30% position)
- Key technical indicator interpretation
- Market sentiment analysis
- Risk warning

**Key Guiding Principles:**

- 1.Position Priority: Focus on risk control when holding positions
- 2.Technical Indicators First: Use latest values from arrays
- 3.Sentiment Analysis Integration: Judgment based on scores from -1 to 1
- 4.Concise Expression: 50-80 words for each rationale
- 5.Actionability: Provide specific price levels
The complete prompt is approximately 2000 words long, including detailed data format specifications, output templates, formatting requirements, etc. For specifics, please refer to the strategy source code at the end of the article.
9、Telegram Push Node
Push the analysis report to Telegram.
Configuration Parameters:
            text

            Operation Type: sendMessage
Chat ID: xxxxxxx  // Your group or channel ID
Message Text: {{ $json.output }}
Parse Mode: HTML
Required Credentials:
Telegram Bot API Token is needed. Obtain the Token by creating a bot through @BotFather.
How to Get Chat ID:
- 1.Add the bot to your group
- 2.Send a message in the group
- 3.Visit https://api.telegram.org/bot<YOUR_BOT_TOKEN>/getUpdates
- 4.Find "chat":{"id":-xxxxxxxxx}
10、AI Trading Decision Node
Use the Sentiment Analysis node for final decision-making.

Configuration Parameters:
            text

            Analyze the technical indicators and market signals in {{ $json.output}}, and make trading decisions by synthesizing the following key elements:

**Decision-Making Priority:**

1.Technical Indicator Combination: MACD signal strength, RSI overbought/oversold status, volume change trends
2.Price Position: Current price relative to entry zone, stop-loss level, and target price
3.Market Sentiment: Comprehensive assessment of short-term sentiment score and long-term outlook score
4.Position Status: Whether there is a current position and cost basis

**Trading Decision Options:**

- **Open Long**: When technical indicators turn bullish, price is at the lower end of entry zone, market sentiment is positive, and there's no position
- **Open Short**: When technical indicators turn bearish, price breaks through stop-loss level, and market sentiment is pessimistic
- **Close Long**: When holding a long position and price reaches target or breaks below stop-loss
- **Close Short**: When holding a short position and technical indicators turn bullish or price rebounds to closing level
- **No Action**: When signals are unclear, in a ranging market, or risk is too high, maintain a wait-and-see approach

**Special Attention**:

- Strictly follow the stop-loss price levels set in the report
- Combine short-term and long-term recommendations for position management
- Consider market volatility and risk warnings when making decisions

**Final Output Format:**
Based on the above analysis, the current trading decision is: [Open Long/Open Short/Close Long/Close Short/No Action]
This node will automatically determine which operation to execute based on the analysis report content, then route to different trade execution nodes accordingly.
11、Trade Execution Nodes
Execute specific operations based on AI decisions. Using "Open Long" as an example:
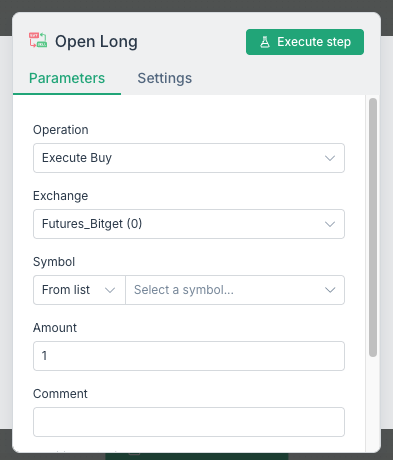
Other operations are similar, directly connecting to the exchange for trade execution based on trading decisions. Then push messages to the APP to help users receive real-time trading operation notifications.
12、Take Profit & Stop Loss Plugin
This is the final risk control measure. When the AI detects no position operations are needed, we need to add another line of defense to check for take profit and stop loss.
            javascript

            function main(contract) {
    var contractsymbol = contract + '_USDT.swap';
    var positions = exchange.GetPositions(contractsymbol);

    if (positions && positions.length > 0) {
        var ticker = exchange.GetTicker();
        // Determine position direction: long=1, short=-1
        var direction = positions[0].Type == 0 ? 1 : -1;

        // Calculate profit/loss ratio
        var pnlRatio = (ticker.Last - positions[0].Price) * direction / positions[0].Price;

        // Determine close order type
        var closeOrderType = direction == 1 ? 'closebuy' : 'closesell';

        // Take profit: close position when profit reaches 3%
        if (pnlRatio >= 0.03) {
            exchange.CreateOrder(positions[0].Symbol, closeOrderType, -1, positions[0].Amount);
            Log('Take profit executed, profit: ' + (pnlRatio * 100).toFixed(2) + '%');
        }
        // Stop loss: close position when loss reaches 1%
        else if (pnlRatio <= -0.01) {
            exchange.CreateOrder(positions[0].Symbol, closeOrderType, -1, positions[0].Amount);
            Log('Stop loss executed, loss: ' + (pnlRatio * 100).toFixed(2) + '%');
        } else {
            Log('No action');
        }

        return {};
    } else {
        return {};
    }
}
Risk Warnings
It must be stated that this system is still in the experimental phase, and the following risks should be noted:
1.API Call Limitations
Alpha Vantage's free version only allows 25 calls per day, requiring reasonable scheduling of call times or upgrading to a paid version.
2.Contract Liquidity
Individual stock contracts on exchanges may still have insufficient liquidity, potentially causing slippage, which requires careful consideration.
3.Price Anomaly Events
Decentralized exchanges may experience price depegging in tokenized stock trading. Since DEXs rely on oracles (such as Pyth, Chainlink) to obtain off-chain stock price data, when oracle data updates are delayed or on-chain liquidity is insufficient, the mark price may significantly deviate from the real US stock price. This reminds us that although crypto exchanges have advantages, technical risks still exist.
4.Market Risk
Crypto exchanges, as derivative trading platforms offering high leverage (up to 1001x), face regulatory risks in an increasingly strict global regulatory environment. Tokenized US stocks themselves are also an emerging field, and policy changes may affect trading.
5.AI Decision Risk
No matter how advanced AI models are, they may: (1) misjudge market signals; (2) over-rely on historical data; (3) fail to respond to black swan events; (4) fail in extreme market conditions. Therefore, caution is needed when referencing them.
6.High Leverage Risk
The high leverage provided by crypto exchanges is a double-edged sword. A 1% adverse price movement can result in total margin loss. Even with a 1% stop-loss set, it may not execute in time during rapid market movements.
Future Improvement Plans
There are many aspects of this system that can be improved:
Short-term Optimization
1.Add more data sources: Integrate on-chain data, social media sentiment, whale position changes, etc.
2.Optimize position management: Dynamically adjust position size based on volatility
3.Improve stop-loss strategy: Use trailing stop-loss or ATR dynamic stop-loss
Medium-term Goals
1.Multi-asset portfolio: Trade multiple US stocks simultaneously to diversify risk
2.Cross-platform arbitrage: Compare price differences among Aster, Bitget, Bybit
3.Enhanced sentiment indicators: Add Fear & Greed Index, VIX, etc.
4.Risk warning system: Automatically close positions for protection during market anomalies
Long-term Vision
When the RWA ecosystem becomes more mature and regulations become clearer:
1.Access more RWA assets: Bonds, real estate, commodities, etc.
2.Develop professional strategies: Grid trading, trend following, statistical arbitrage
3.Build investment portfolios: Diversified allocation of cryptocurrencies + US stocks + bonds
4.Community-based operations: Open-source strategies, accept community supervision and improvements
Conclusion
This exploration hopefully helps everyone gain a deeper understanding of RWA and tokenized US stocks. Crypto platforms connecting DeFi and traditional finance through tokenized stocks have indeed opened new possibilities. But we must soberly recognize:
This is not a mature profit-making system, but a technical experiment.
The current tokenized US stock market is still very young. Although RWA is developing rapidly, it has also experienced technical failures. High-leverage trading is an extremely high-risk game. If you want to try:
1.Simulated trading: Debug and optimize strategies on simulated exchanges
2.Use only spare money: Invest amounts you can afford to lose completely
3.Start small: Test with minimum contract sizes first
4.Continuous learning: Closely monitor regulatory developments and technical updates
5.Strict risk control: Always set stop-losses, control leverage multiples
6.Stay rational: Don't be completely bound by AI decisions; final judgment is yours
The code and configuration in this article are publicly available, and everyone is welcome to discuss improvements. But please remember: All trading carries risks, and automation does not equal guaranteed profits.
In this new era of RWA, we are all explorers. Proceed cautiously and learn together.
Strategy URL: https://www.fmz.com/strategy/510237
Disclaimer: This article is for technical communication only and does not constitute any investment advice. Cryptocurrency and derivative trading carries extremely high risks. Please be sure to understand the risks and make prudent decisions.
- 1