
A Real Scenario
3 AM on Black Friday, you're scrolling through your phone and see BTC breaking through new lows. Your heart races, your finger hovers over the "Buy" button. Countless thoughts flash through your mind:
- "If I don't buy the dip now, it'll be too late!"
- "What about the technicals? Forget it, no time to check"
- "How much money do I have left in my account? Whatever, buy first, think later"
You press the button. The next day you wake up to an 8% crash, liquidated and out of the game.
This is the daily reality for 90% of retail traders. I was one of them, until I built this tool.
Core Concept: Adding a Gate Between Impulse and Order Execution
What this tool does is very simple:
Your trading impulse → Forced to write down reasons → AI rational analysis → Provides actionable plan → Records growth trajectory
The key lies in three unique design elements:
1. Forced to Write Down "Why"
The form requires filling in "trading rationale". When you try to describe in words "why you want to make this trade", many impulses naturally fade away.
            javascript

            ❌ Vague impulse: "Feels like it's going up"
✅ Specific reasoning: "Breakout above 120-day MA + MACD golden cross + volume expansion"
2. AI Validates Your Logic from Multiple Dimensions**
The system automatically collects 4 types of data and conducts comprehensive analysis:
Data Collection:
            Position Info        ──┐
Sentiment Analysis   ──┼──→ Data Merge → AI Analysis
Technical Indicators ──┤
Trading Rationale    ──┘
AI's 4 Analysis Dimensions:
- 0️⃣ Trading Logic Validation (most important): Identifies cognitive biases, verifies if logic holds
- 1️⃣ Technical Signal Verification: Whether MACD/RSI/ATR/OBV support your judgment
- 2️⃣ Emotional Risk Assessment: Is market sentiment greedy or fearful
- 3️⃣ Entry Timing Judgment: Enter now or wait for pullback/breakout
Outputs comprehensive analysis across multiple fields:
            json

            {
  "original_rationale": "Down 5%, should be the bottom",
  "rationale_evaluation": "Unreasonable",
  "fatal_flaw": "Anchoring bias—5% drop doesn't mean sufficient",
  "validation_result": "MACD=-213 deep bearish, RSI=31 no bullish divergence",
  "execution_advice": "Abandon trade",
  "suggested_entry_price": "Not recommended",
  "stop_loss_price": "$115,000",
  "take_profit_target_1_price": "$125,000",
  // ...
}
3. Trading Log Records Your Growth Journey
Each trading insight analysis is automatically saved to a CSV file. After a month, you'll see:
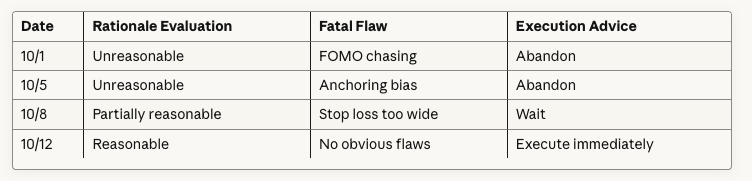
This is your evolution from impulse to rationality.
System Architecture
Complete Flow Diagram:
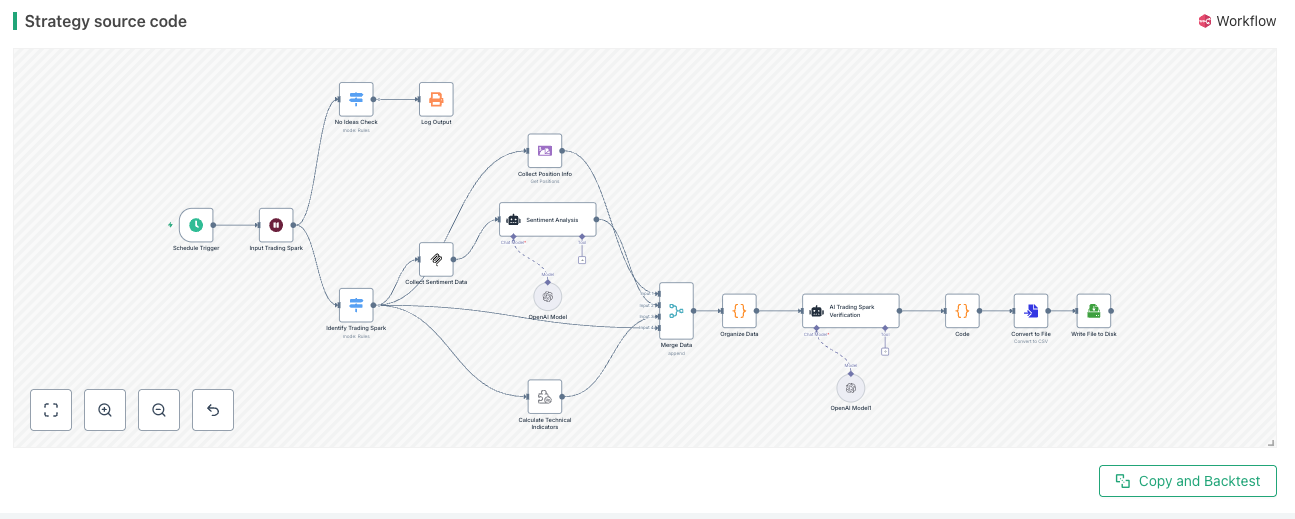
            Workflow Trigger → Form Input → Null Value Check → [Data Collection] → Data Consolidation → AI Analysis → Storage → Export CSV
                                                ↓
                            ┌───────────────────┼───────────────────┐
                            ↓                   ↓                   ↓
                    Position Info      Sentiment Analysis    Technical Indicators
Layer 1: Trading Inspiration CaptureNode Name: Input Trading Spark
Type: Wait Node (Form Mode)
            javascript

            // Form field configuration
{
  "tradingAsset": "text",        // e.g., BTC
  "tradingDirection": "dropdown", // LONG/SHORT/COVERLONG/COVERSHORT
  "tradingQuantity": "number",    // e.g., 1
  "tradingRationale": "text"      // Core! Must fill in reason
}
Key Design:
- Form is followed by Switch node to check if trading spark exists, then proceed to AI validation
Layer 2: Data Collection (3 Parallel Paths)
2.1 Position Information Collection
Node Name: Collect Position Information
Type: accountInfo Node
            javascript

            // Query current asset position
symbol: "{{ $json['tradingAsset'] }}_USDT.swap"
operation: "getPosition"

// Output example
{
  "symbol": BTC,      // Position asset
  "amount": 0.5,      // Position quantity
  "price": 110003     // Direction
}
2.2 Sentiment Data Collection
Node Name: Collect Sentiment Data → Sentiment Information Analysis
Type: MCP Client + AI Agent
Step 1: Get News
            javascript

            // Alpha Vantage MCP interface
endpointUrl: "https://mcp.alphavantage.co/mcp?apikey='YOUR_KEY'"
tool: "NEWS_SENTIMENT"
tickers: "CRYPTO:{{ $json['tradingAsset'] }}"
Step 2: AI Extract Sentiment
            javascript

            // AI structured sentiment analysis output
{
  "shortTermSentiment": {
    "category": "Positive",
    "score": 0.7,
    "rationale": "Broke key resistance in 24 hours, social media heat rising"
  },
  "longTermSentiment": {
    "category": "Neutral",
    "score": 0.0,
    "rationale": "Regulatory uncertainty persists, institutional entry slowing"
  }
}
Why is sentiment data important?
One of the biggest gaps between retail traders and institutions is information access capability. Through recent news sentiment analysis, we can timely understand:
- Mainstream media reporting bias on specific coins
- Market participant sentiment trend changes
- Major news event impact assessment
This fills critical information gaps.
2.3 Technical Indicators Calculation
Node Name: Signal Indicators Calculation
Type: tradingPlugin Node
javascript
function main(inputData) {
const symbol = inputData + "_USDT.swap"
const records = exchange.GetRecords(symbol)
// Data validation
if (records.length <= 10) {
Log("Error: Insufficient data");
return null;
}
// Calculate technical indicators (using talib library)
const macd = talib.MACD(records);
const rsi = talib.RSI(records, 14);
const atr = talib.ATR(records, 14);
const obv = talib.OBV(records);
// Get last 10 values
function getLast10Values(arr) {
if (!arr || arr.length === 0) return [];
return arr.slice(-10);
}
return {
MACD: {
macd: getLast10Values(macd[0]),
signal: getLast10Values(macd[1]),
histogram: getLast10Values(macd[2])
},
RSI: getLast10Values(rsi),
ATR: getLast10Values(atr),
OBV: getLast10Values(obv)
};
}
Returned Technical Indicators:
- MACD (Trend Indicator): Golden cross/Death cross/Divergence
- RSI (Oscillator): Overbought (>70)/Oversold (<30)
- ATR (Volatility): For dynamic stop loss
- OBV (Volume): Capital flow direction
2.4 Trading Intention
Directly passed from form, including asset, direction, quantity, trading rationale.
Layer 3: Data Consolidation
Node Name: Data Consolidation
Type: Code Node (JavaScript)
            javascript

            // Initialize containers
let posData = null;
let contentData = null;
let technicalIndicators = null;
let tradeIdea = null;

// Iterate through all inputs from merge node
for (const item of items) {
  // =============== Position Data ===============
  if (item.json.operation === 'getPosition' && item.json.result !== undefined) {
    posData = item.json.result;
    // Key conversion: numbers → readable text
    posData.amount = posData.amount == 0 ? "No position" :
                     posData.amount > 0 ? "Long position" : "Short position";
  }

  // =============== Sentiment Analysis Results ===============
  if (item.json.output !== undefined) {
    try {
      contentData = JSON.parse(item.json.output);
    } catch (e) {
      contentData = item.json.output;
    }
  }

  // =============== Technical Indicator Data ===============
  if (item.json.MACD !== undefined || item.json.RSI !== undefined) {
    technicalIndicators = {
      "Trend Indicator MACD": item.json.MACD,
      "Oscillator RSI": item.json.RSI,
      "Volatility Indicator ATR": item.json.ATR,
      "Volume Analysis OBV": item.json.OBV
    };
  }

  // =============== Trading Intention ===============
  if (item.json["tradingAsset"] !== undefined) {
    tradeIdea = {
      "tradingAsset": item.json["tradingAsset"],
      "tradingDirection": item.json["tradingDirection"],
      "tradingQuantity": item.json["tradingQuantity"],
      "tradingRationale": item.json["tradingRationale"] // Core!
    };
  }
}

// =============== Return Aggregated Results ===============
return [{
  json: {
    "positionData": posData,
    "sentimentAnalysis": contentData,
    "technicalIndicators": technicalIndicators,
    "tradingIntention": tradeIdea
  }
}];
Why do we need this node?
- Four data streams have inconsistent formats, need standardization
- Position values need conversion to readable text
- Technical indicators add Chinese descriptions for AI understanding
Layer 4: AI Trading Spark Validation
Node Name: AI Trading Spark Validation
Type: Agent Node
This is the soul of the entire system. The prompt design includes a strict analysis framework:
Analysis Framework (4 Dimensions):
0️⃣ Trading Logic Validation (Highest Priority)
- Is this reasoning valid? (Verify with technical indicators + sentiment data)
- Are there cognitive biases? (FOMO/Anchoring bias/Gambler's fallacy)
- Is risk-reward ratio reasonable? (At least 2:1)
1️⃣ Technical Signal Verification
- Does MACD direction support trading direction?
- Is RSI overbought/oversold?
- Is OBV diverging from price?
2️⃣ Emotional Risk Assessment
- Short-term sentiment score? (>0.6 extreme greed/<-0.6 extreme fear)
- Are there black swan events?
3️⃣ Entry Timing Judgment
- Is current price level reasonable?
- Should wait for pullback/breakout?
Output Requirements: Complete Analysis Fields
            json

            {
  "analysisTime": "2025-10-11T10:30:00.000Z",
  "tradingAsset": "BTC",
  "tradingDirection": "LONG",
  "tradingQuantity": "1",
  "originalRationale": "Down 5%, should be the bottom",
  "rationaleEvaluation": "Unreasonable",
  "validationResult": "MACD=-213 deep bearish, RSI=31 no bottom divergence, OBV continuous outflow",
  "fatalFlaw": "Anchoring bias—5% drop doesn't constitute reversal reason",
  "executionAdvice": "Abandon trade",
  "confidence": "High",
  "basis_logicValidation": "Trading logic has serious flaws",
  "basis_technicals": "MACD/RSI/OBV all show bearish trend not ended",
  "basis_riskPoints": "Blind bottom fishing may encounter double bottom, potential loss 15%+",
  "suggestedEntryPrice": "Not recommended",
  "suggestedEntryCondition": "Trading logic has major flaws",
  "suggestedEntryTime": "Abandon current plan",
  "stopLossPrice": "$115,000",
  "stopLossReason": "Break below key support",
  "takeProfit1_price": "$125,000",
  "takeProfit1_position": "50%",
  "takeProfit1_reason": "Backtested resistance",
  "takeProfit2_price": "$132,000",
  "takeProfit2_position": "Remaining position",
  "takeProfit2_reason": "Key round number",
  "coreRisk": "Currently in mid-downtrend, bottom fishing too early may trigger stop loss",
  "riskRewardRatio": "0.5:1",
  "potentialReturnPercent": "5%",
  "maxLossPercent": "10%",
  "riskLevel": "High risk",
  "operationSummary": "Abandon bottom fishing plan, wait for MACD golden cross + RSI bottom divergence",
  "decisionValidity": "Until technicals show clear reversal signal",
  "reviewCondition": "MACD golden cross or RSI forms bottom divergence or volume surge"
}
Field Analysis
- Covers all key elements of trading decisions
- Completely flattened for easy CSV storage
- Each field is actionable with clear trigger conditions
Special Case Handling Rules:
The prompt specifically defines 3 special cases:
1、When "trading rationale" is clearly unreasonable
- Execution suggestion must be set to “Abandon trade”.
- Fatal flaw must clearly specify the type of cognitive bias.
- Suggested entry price should be written as “Not recommended to enter”.
2、When market is extremely volatile
- Risk level marked as “Extremely high risk”.
- Decision validity period shortened to “Valid within 1 hour”.
3、When technical indicators contradict
- Confidence level marked as “Low”.
- Execution suggestion prioritized as “Wait to enter”.
Layer 5: Storage and Export
5.1 Save Analysis Results
Type: Code Node
            javascript

            const rawData = $input.first().json.output;

// Function to extract JSON content (handles possible markdown wrapping)
function extractJSON(outputString) {
  const jsonMatch = outputString.match(/```json\n([\s\S]*?)\n```/);
  if (jsonMatch && jsonMatch[1]) {
    return JSON.parse(jsonMatch[1]);
  }
  // If no markdown wrapping, parse directly
  return JSON.parse(outputString);
}

const result = extractJSON(rawData);
Log("Current trade analysis:", result);

// Use _G global storage function (key!)
let tradelog = _G('tradelog') || []; // Initialize fallback

// Add latest record
tradelog.push(result);

// Persistent save
_G('tradelog', tradelog);

return tradelog;
Value of _G Function:
- Data persistent storage, exists after workflow restart
- Can share data across workflows
- Perfect for recording historical trading decisions
5.2 Convert to CSV
Type: convertToFile Node
Converts JSON array to CSV format, including all fields.
5.3 Save to Local
Type: writeFile Node
Saves to local tradelog.csv.
Long-term Value of CSV File:
This file records your trading mindset evolution:
            Week 1: 10 ideas → 7 "unreasonable" → Cognitive bias: FOMO
Week 2: 8 ideas → 5 "unreasonable" → Starting to realize problems
Week 4: 6 ideas → 3 "unreasonable" → Learning to wait for technical signals
Week 8: 5 ideas → 1 "unreasonable" → Thinking starts maturing
...
This is a trading master's growth diary.
Part 4: Realistic Expectations
This tool is not omnipotent:
❌ Cannot predict the future: AI based on historical data, fails when black swans arrive
❌ Cannot replace intuition: Veteran traders' "market sense" is hard to quantify
❌ Cannot guarantee profits: Can only improve decision quality, not guarantee every trade wins
❌ Cannot fight extreme markets: When market goes crazy, rational analysis might backfire
But it can:
✅ Let you know the risk of every trade
✅ Help identify cognitive biases
✅ Record your growth trajectory
✅ Avoid the most basic mistakes
Part 5: Evolution Direction
Short-term Optimization:
- Connect more data sources (on-chain data, funding rates)
- Add historical backtesting module
- Use ATR for dynamic stop loss calculation
Further Improvements:
- Connect exchange API for semi-automatic order placement
- Multiple AI Agents voting (aggressive vs conservative)
- Adjust sentiment/technical weights based on market environment
Part 6: Usage Guide
6.1 Copy Strategy
Click the strategy link at the end of the article, click copy strategy.
6.2 Configuration
Need to configure 3 APIs:
1、Alpha Vantage (sentiment data): Configure in MCP client node
2、OpenAI (AI model): Configure in two OpenAI model nodes
3、Exchange (position query, needed for live trading): Configure in exchange section
6.3 View Trading Log
tradelog.csv location:
            bash

            # 1. Enter custodian log directory
cd ~/logs/storage

# 2. Find your strategy ID directory (e.g., 620669)
cd 620669/files

# 3. View trading log
cat tradelog.csv
6.4 Best Practices
Fill out the form every time you have a trading impulse, let AI help you analyze calmly. Suggest reviewing tradelog.csv every weekend to see which mistakes you make most often (FOMO? Blind bottom fishing?). After 1-2 months of continuous use, you'll clearly see your evolution from impulse to rationality.
Part 7: Final Thoughts
The greatest value of this tool is not how much money it helped you make, but:
It forces you to ask yourself before every order: Why am I making this trade?
- If you can’t answer → this is gambling.
- If you can answer but AI points out flaws → this is learning.
- If both you and AI consider it reasonable but still lose → this is normal trial and error.
The ultimate goal of trading is not to beat the market, but to understand yourself. Understand your greed, fear, and self-righteousness.
This trading log file is your path to self-awareness.
Appendix
Technical Support: Welcome to discuss in comments
Disclaimer: Tool for learning only, trading has risks, please make careful decisions
If this article helped you, feel free to share with friends also struggling on the trading path. We all need a calm voice to say when impulse arrives: "Wait, are you sure?"
Strategy Link: https://www.fmz.com/strategy/511853
Note: This framework is just an initial implementation, needs more bug fixes and feature improvements.
- 1