
Opening: What Can Workflows Do?
Many people think workflows can only handle simple automation tasks, but their capabilities are far more powerful than imagined. Especially on the FMZ Quant platform, workflows can not only run traditional strategies but also enable AI to monitor the market, make decisions, and adjust parameters during strategy execution.
Simply put: traditional strategies handle the execution, while AI handles the thinking.
Today, through a practical case study, let's discuss how to combine these two elements to make strategies more intelligent.
1. First, Let's Talk About the Pain Points of Traditional Strategies
We'll use one of the most common examples: the bidirectional grid trading strategy.
What is a Bidirectional Grid Strategy?
This is a grid strategy that operates in both long and short directions simultaneously:
- Long grid: Opens long positions in batches when prices fall, closes positions for profit when prices rise
- Short grid: Opens short positions in batches when prices rise, closes positions for profit when prices fall
- Regardless of whether prices rise or fall, it profits from volatility through price differences
This strategy generates stable returns in ranging markets, but it has a fatal flaw: the parameters are fixed.
An Example
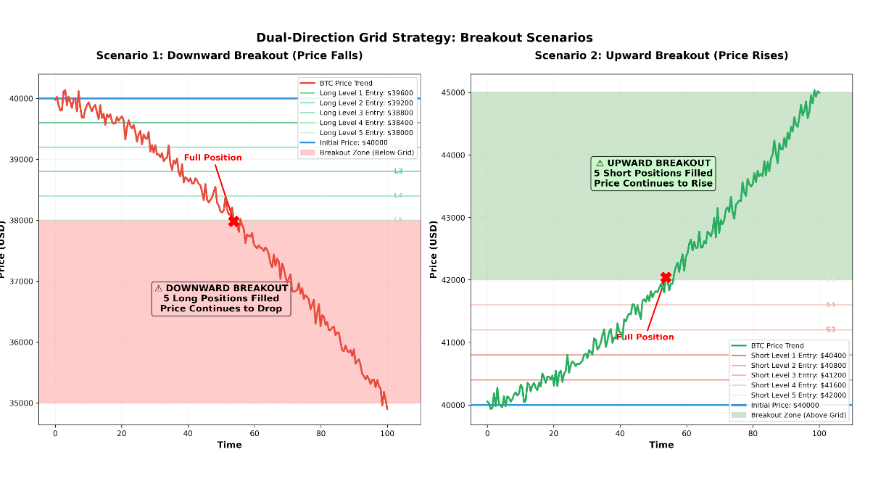
Let's say you set up a bidirectional grid for BTC starting at $40,000, with a 1% step size and a maximum of 5 levels:
Long Grid (Price Decline Zone):
- Buy first level at $39,600
- Buy second level at $39,200
- Buy third level at $38,800
- Buy fourth level at $38,400
- Buy fifth level at $38,000 (fully positioned)
Short Grid (Price Rally Zone):
- Open short first level at $40,400
- Open short second level at $40,800
- Open short third level at $41,200
- Open short fourth level at $41,600
- Open short fifth level at $42,000 (fully positioned)
The Problem Arises
What if BTC suddenly crashes unilaterally to $35,000?
- All 5 long position levels are already opened, and the price continues to fall
- All positions are deeply trapped with expanding floating losses
- The initial price of $40,000 is fixed, and the grid cannot automatically adjust
- You might have to wait a long time for the price to return to the grid range
Or conversely, what if BTC surges to $45,000?
- All 5 short position levels are fully opened, and the price continues to rise
- Short positions continue to lose money, but the grid can't keep up with the pace
- Traditional strategies can only wait helplessly, powerless to act
This is the limitation of traditional strategies—they don't actively think about market changes.
So, is there a way to make strategies smarter? The answer is: combine traditional strategies with AI using workflows. Below, we'll look at how to use the FMZ platform's workflows to allow AI to intervene at critical moments and help strategies make adjustment decisions.
2. Overall Workflow Architecture
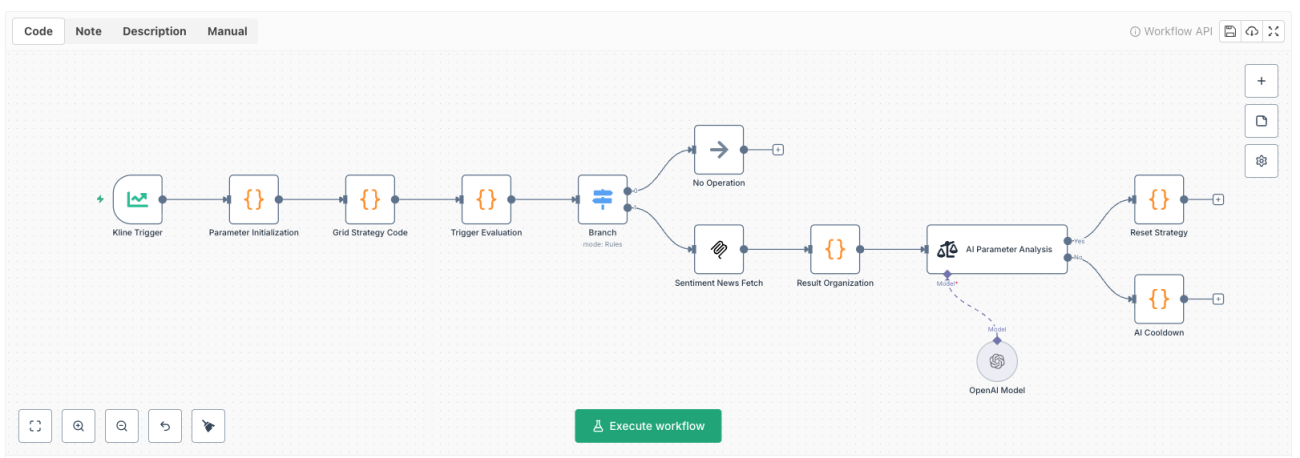
Node Flow Diagram
javascript
┌─────────────────────┐
│ K-line Close Trigger│ ← Triggers every 60 seconds
└──────────┬──────────┘
↓
┌─────────────────────┐
│ Parameter Init Node │ ← First run or after reset: initialize grid
│ │ (includes volatility check)
└──────────┬──────────┘
↓
┌─────────────────────┐
│ Grid Strategy Code │ ← Execute open/close position logic
│ Node │
└──────────┬──────────┘
↓
┌─────────────────────┐
│ Trigger Check Node │ ← Monitor positions + determine if AI trigger
│ │ (cooldown period)
└──────────┬──────────┘
↓
┌─────────────────────┐
│ Branch Decision Node│ ← Route based on trigger conditions
└────┬─────────┬──────┘
│ │
false true
│ │
↓ ↓
┌────────┐ ┌─────────────────────┐
│No Action│ │ Sentiment News Fetch │ ← Alpha Vantage API
└────────┘ │ (MCP) │
└──────────┬──────────┘
↓
┌─────────────────────┐
│ Results Aggregation │ ← Integrate news + position data
│ Node │
└──────────┬──────────┘
↓
┌─────────────────────┐
│ AI Parameter Analysis│ ← Sentiment analysis node judges Yes/No
│ Node (Sentiment) │
└────┬─────────┬──────┘
│ │
Yes No
│ │
↓ ↓
┌────────────┐ ┌────────┐
│Reset Strategy│ │AI Cooldown│ ← Record lastAItime
│·Close all │ └────────┘
│ positions │
│·Clear grid │
│·Clear price│
│·Record time│
└────────────┘
│
↓
(Reinitialize in next cycle)
Global Variable Configuration
Before starting, you need to configure the following variables in the n8n workflow:
            javascript

            $vars.contract = "BTC_USDT.swap"   // Trading pair
$vars.maxPositions = 5             // Maximum number of grid levels
$vars.stepPercent = 0.01           // Grid step size (1%)
$vars.lotSize = 0.001              // Lot size per trade
3. Detailed Code for Each Node
Node 1: K-line Close Trigger
Node Name: K-line Close Trigger 1
Node Type: klineCloseTrigger
Function Description:
- This is the heart of the entire workflow, automatically triggering once every 60 seconds
- When triggered, it pulls the latest 500 K-line data points
- After triggering, the flow automatically proceeds to the next node
Node 2: Parameter Initialization
Node Name: Parameter Initialization
Node Type: Code
Complete Code:
            javascript

            let grid = _G('grid');
let initPrice = _G('initPrice');
let initEquity = _G('initEquity');

// ========== Read configuration parameters from n8n variables ==========
let maxPositions = $vars.maxPositions;      // Maximum number of grid levels
let stepPercent = $vars.stepPercent;        // Grid step size
let volatilityThreshold = 0.02; // Volatility threshold (default 2%)
let volatilityPeriod = 20; // Volatility calculation period (default 20 K-lines)

// ========== Volatility check function ==========
function checkVolatility() {
  // Get historical K-line data
  let records = exchange.GetRecords();
  if (!records || records.length < volatilityPeriod) {
    Log('Insufficient K-line data, cannot calculate volatility');
    return { isHigh: false, value: 0 };
  }

  // Calculate price volatility for recent N K-lines
  let prices = [];
  for (let i = records.length - volatilityPeriod; i < records.length; i++) {
    prices.push(records[i].Close);
  }

  // Calculate average price
  let avgPrice = prices.reduce((a, b) => a + b, 0) / prices.length;

  // Calculate standard deviation
  let squareDiffs = prices.map(price => Math.pow(price - avgPrice, 2));
  let avgSquareDiff = squareDiffs.reduce((a, b) => a + b, 0) / squareDiffs.length;
  let stdDev = Math.sqrt(avgSquareDiff);

  // Calculate volatility (standard deviation / average price)
  let volatility = stdDev / avgPrice;

  Log('Current volatility:', (volatility * 100).toFixed(2) + '%',
      'Threshold:', (volatilityThreshold * 100).toFixed(2) + '%');

  return {
    isHigh: volatility > volatilityThreshold,
    value: volatility
  };
}

// ========== Check volatility before initialization ==========
if (!grid || Object.keys(grid).length === 0) {

  // Check volatility
  let volatilityCheck = checkVolatility();

  if (volatilityCheck.isHigh) {
    Log('⚠️ Current market volatility is too high:', (volatilityCheck.value * 100).toFixed(2) + '%');
    Log('Waiting for market to stabilize before initializing grid...');
    return {
      status: 'waiting',
      reason: 'high_volatility',
      volatility: volatilityCheck.value
    };
  }

  Log('✓ Volatility check passed, starting grid initialization');

  // ========== Get initial equity ==========
  if (!initEquity) {
    let equity = exchange.GetAccount();
    if (equity) {
      initEquity = equity.Equity;
      _G('initEquity', initEquity);
      Log('Using current market equity as initial equity:', initEquity);
    } else {
      Log('Failed to get market account');
      return null;
    }
  }

  // ========== Get initial price ==========
  if (!initPrice) {
    let ticker = exchange.GetTicker();
    if (ticker) {
      initPrice = ticker.Last;
      _G('initPrice', initPrice);
      Log('Using current market price as initial price:', initPrice);
    } else {
      Log('Failed to get market price');
      return null;
    }
  }

  // ========== Initialize grid ==========
  grid = {
    // ========== Configuration parameters ==========
    stepPercent: stepPercent,        // Grid step size
    maxPositions: maxPositions,      // Maximum number of grid levels

    // ========== Grid data ==========
    longOpenPrices: [],    // Target long position open prices array
    longClosePrices: [],   // Target long position close prices array
    longPositions: [],     // Long position status array
    shortOpenPrices: [],   // Target short position open prices array
    shortClosePrices: [],  // Target short position close prices array
    shortPositions: []     // Short position status array
  };

  // Initialize long grid (open long when price falls)
  for (let i = 1; i <= maxPositions; i++) {
    grid.longOpenPrices.push(initPrice * (1 - stepPercent * i));
    grid.longClosePrices.push(initPrice * (1 - stepPercent * (i - 1)));
    grid.longPositions.push({
      isOpen: false,
      openTime: null,
      openPrice: null
    });
  }

  // Initialize short grid (open short when price rises)
  for (let i = 1; i <= maxPositions; i++) {
    grid.shortOpenPrices.push(initPrice * (1 + stepPercent * i));
    grid.shortClosePrices.push(initPrice * (1 + stepPercent * (i - 1)));
    grid.shortPositions.push({
      isOpen: false,
      openTime: null,
      openPrice: null
    });
  }

  _G('grid', grid);
  Log('========== Grid initialization complete ==========');
  Log('Initial price:', initPrice);
  Log('Initial equity:', initEquity);
  Log('Grid step size:', (stepPercent * 100) + '%');
  Log('Maximum levels:', maxPositions);
  Log('Current volatility:', (volatilityCheck.value * 100).toFixed(2) + '%');
  Log('Long grid range:', grid.longOpenPrices[0].toFixed(2), '-', grid.longOpenPrices[maxPositions-1].toFixed(2));
  Log('Short grid range:', grid.shortOpenPrices[0].toFixed(2), '-', grid.shortOpenPrices[maxPositions-1].toFixed(2));
  Log('===================================');
}

return {};
Function Description:
- Only executes initialization when the strategy needs to restart; skips directly during normal strategy operation
- Strategy initialization requires stable conditions, so volatility checking is added to prevent opening positions during violent fluctuations, which could cause additional losses
- Uses the _G() function to implement data persistence, ensuring data is not lost after restart
- Initializes three key pieces of data: initial equity, initial price, and grid structure
- Calculates grid price arrays for both long and short directions
Node 3: Grid Strategy Source Code
Node Name: Grid Strategy Source Code
Node Type: Code
Complete Code:
            javascript

            var lotSize = $vars.lotSize || 0.001; // Lot size per trade

var grid = _G('grid');
var initPrice = _G('initPrice');

// If strategy is not initialized, exit directly
if (!initPrice || !grid) {
    return {};
}

// ========== Long position opening check function ==========
function checkLongOpen(price) {
    for (var i = 0; i < grid.longOpenPrices.length; i++) {
        // Condition 1: Price is lower than or equal to target opening price
        // Condition 2: This level currently has no position
        if (price <= grid.longOpenPrices[i] && !grid.longPositions[i].isOpen) {
            Log('Preparing to open long position');

            // Set trading direction to buy (go long)
            exchange.SetDirection('buy');

            // Place market order: -1 means market price, lotSize is quantity
            var orderId = exchange.Buy(-1, lotSize);

            if (orderId) {
                // Record opening information
                grid.longPositions[i] = {
                    isOpen: true,           // Mark as opened
                    openTime: Date.now(),   // Record opening timestamp
                    openPrice: price        // Record opening price
                };

                // Persist and save
                _G('grid', grid);

                Log('✓ Open Long Level', i + 1,
                    'Opening price:', price,
                    'Target closing price:', grid.longClosePrices[i]);
            }
        }
    }
}

// ========== Long position closing check function ==========
function checkLongClose(price) {
    for (var i = 0; i < grid.longClosePrices.length; i++) {
        // Condition 1: This level has a position
        // Condition 2: Price has reached or exceeded target closing price
        if (grid.longPositions[i].isOpen && price >= grid.longClosePrices[i]) {
            Log('Preparing to close long position');

            // Set trading direction to close long
            exchange.SetDirection('closebuy');

            // Place market order to close position
            var orderId = exchange.Sell(-1, lotSize);

            if (orderId) {
                // Calculate profit percentage
                var profit = ((price - grid.longPositions[i].openPrice) /
                             grid.longPositions[i].openPrice * 100).toFixed(2);

                Log('✓ Close Long Level', i + 1,
                    'Opening price:', grid.longPositions[i].openPrice,
                    'Closing price:', price,
                    'Profit:', profit + '%');

                // Clear position information
                grid.longPositions[i] = {
                    isOpen: false,
                    openTime: null,
                    openPrice: null
                };

                // Persist and save
                _G('grid', grid);
            }
        }
    }
}

// ========== Short position opening check function ==========
function checkShortOpen(price) {
    for (var i = 0; i < grid.shortOpenPrices.length; i++) {
        // Condition 1: Price is higher than or equal to target opening price
        // Condition 2: This level currently has no position
        if (price >= grid.shortOpenPrices[i] && !grid.shortPositions[i].isOpen) {
            Log('Preparing to open short position');

            // Set trading direction to sell (go short)
            exchange.SetDirection('sell');

            // Place market order to open short
            var orderId = exchange.Sell(-1, lotSize);

            if (orderId) {
                // Record opening information
                grid.shortPositions[i] = {
                    isOpen: true,
                    openTime: Date.now(),
                    openPrice: price
                };

                _G('grid', grid);

                Log('✓ Open Short Level', i + 1,
                    'Opening price:', price,
                    'Target closing price:', grid.shortClosePrices[i]);
            }
        }
    }
}

// ========== Short position closing check function ==========
function checkShortClose(price) {
    for (var i = 0; i < grid.shortClosePrices.length; i++) {
        // Condition 1: This level has a position
        // Condition 2: Price has reached or is below target closing price
        if (grid.shortPositions[i].isOpen && price <= grid.shortClosePrices[i]) {
            Log('Preparing to close short position');

            // Set trading direction to close short
            exchange.SetDirection('closesell');

            // Place market order to close position
            var orderId = exchange.Buy(-1, lotSize);

            if (orderId) {
                // Calculate profit percentage (short profit = opening price - closing price)
                var profit = ((grid.shortPositions[i].openPrice - price) /
                             grid.shortPositions[i].openPrice * 100).toFixed(2);

                Log('✓ Close Short Level', i + 1,
                    'Opening price:', grid.shortPositions[i].openPrice,
                    'Closing price:', price,
                    'Profit:', profit + '%');

                // Clear position information
                grid.shortPositions[i] = {
                    isOpen: false,
                    openTime: null,
                    openPrice: null
                };

                _G('grid', grid);
            }
        }
    }
}

// ========== Main logic ==========
// Get current market price
var ticker = exchange.GetTicker();
if (!ticker) {
    Log('Failed to get ticker');
    return {};
}

var price = ticker.Last;

// Check long and short open/close sequentially
checkLongOpen(price);      // Check if long position needs to be opened
checkLongClose(price);     // Check if long position needs to be closed
checkShortOpen(price);     // Check if short position needs to be opened
checkShortClose(price);    // Check if short position needs to be closed

return {};
Function Description:
- Four independent functions handle long/short open/close logic separately
- Each execution traverses all grid levels to check if conditions are triggered
- Uses market orders (-1) to ensure execution
- Immediately persists and saves state changes
Trading Logic Example:
            Scenario 1: Price drops from 40,000 to 39,500
→ checkLongOpen detects price(39,500) <= longOpenPrices0
→ Opens long position Level 1, records opening price 39,500
→ Waits for price to rise back to 40,000 to close position

Scenario 2: Price rises from 39,500 back to 40,100
→ checkLongClose detects price(40,100) >= longClosePrices0
→ Closes long position Level 1, profit (40,100-39,500)/39,500 = 1.52%
Node 4: Trigger Judgment
Node Name: Trigger Judgment
Node Type: Code
Complete Code:
            javascript

            // ========== Trigger Judgment Node ==========
var grid = _G('grid');
var ticker = exchange.GetTicker();
var curaccount = exchange.GetAccount();
var initPrice = _G('initPrice');
var initEquity = _G('initEquity');

if (!ticker || !grid || !initPrice || !curaccount || !initEquity) {
    return {};
}

let curProfit = curaccount.Equity - initEquity;
LogProfit(curProfit, "&");

var currentPrice = ticker.Last;
var now = Date.now();
var maxPositions = grid.maxPositions || 5;

// Count open positions and total floating P&L
var openCount = 0;
var lastOpenPosition = null;
var totalProfit = 0;
var longCount = 0;
var shortCount = 0;

// Count long positions
for (var i = 0; i < grid.longPositions.length; i++) {
    if (grid.longPositions[i].isOpen) {
        openCount++;
        longCount++;
        lastOpenPosition = grid.longPositions[i];
        var posProfit = ((currentPrice - grid.longPositions[i].openPrice) / grid.longPositions[i].openPrice) * 100;
        totalProfit += posProfit;
    }
}

// Count short positions
for (var i = 0; i < grid.shortPositions.length; i++) {
    if (grid.shortPositions[i].isOpen) {
        openCount++;
        shortCount++;
        lastOpenPosition = grid.shortPositions[i];
        var posProfit = ((grid.shortPositions[i].openPrice - currentPrice) / grid.shortPositions[i].openPrice) * 100;
        totalProfit += posProfit;
    }
}

// Build position table
var table = {
    type: "table",
    title: "Bidirectional Grid Positions",
    cols: ["Init Price", "Current Price", "Grid Step", "Long Count", "Short Count", "Total Pos", "Init Equity", "Current Equity", "Cumulative P&L", "Floating P&L%"],
    rows: [[
        _N(initPrice, 2),
        _N(currentPrice, 2),
        _N(grid.stepPercent * 100, 2) + '%',
        longCount,
        shortCount,
        openCount + '/' + maxPositions,
        _N(initEquity, 2),
        _N(curaccount.Equity, 2),
        _N(curProfit, 2),
        _N(totalProfit, 2) + '%'
    ]]
};

LogStatus(`" + JSON.stringify(table) + "`");

// Don't trigger AI if not fully positioned
if (openCount < maxPositions) {
    return { aiTrigger: { shouldTrigger: false } };
}

// Check AI cooldown time
var lastAItime = _G('lastAItime');
if (lastAItime && (now - lastAItime) < 600000) {
    Log('AI cooling down, remaining', ((600000 - (now - lastAItime)) / 60000).toFixed(1), 'minutes');
    return { aiTrigger: { shouldTrigger: false } };
}

// Calculate conditions when fully positioned
var holdHours = (now - lastOpenPosition.openTime) / 3600000;
var priceDeviation = Math.abs(currentPrice / lastOpenPosition.openPrice - 1);

// Price deviation > 3% or holding time > 24 hours
var shouldTriggerAI = priceDeviation > 0.03 || holdHours >= 24;

if (shouldTriggerAI) {
    Log('Triggering AI analysis Deviation:', (priceDeviation * 100).toFixed(2) + '% Duration:', holdHours.toFixed(1), 'hours');
}

return {
    aiTrigger: {
        shouldTrigger: shouldTriggerAI
    }
};
Function Description:
- Real-time monitoring of all position statuses
- Calculates multiple key metrics: number of positions, floating P&L, holding duration, price deviation
- Displays visualization table in status bar
- Core judgment logic: After AI cooldown time is reached, AI is only triggered when fully positioned + abnormal conditions
Trigger Condition Details:
            AI Cooldown:
When AI cooldown time is met, proceed with AI trigger;

Condition Combination:
Fully positioned (openCount >= 5)
    AND
    (
        Price deviation > 3%  OR  Holding duration > 24 hours
    )

Practical Examples:
Scenario 1: 3 positions open → Not triggered (not fully positioned)
Scenario 2: 5 positions open, held 12 hours, 1.5% deviation → Not triggered (threshold not reached)
Scenario 3: 5 positions open, held 30 hours, 1% deviation → Triggered (held too long)
Scenario 4: 5 positions open, held 5 hours, 5% deviation → Triggered (large price deviation)
Node 5: Branch Decision
Node Name: Branch
Node Type: Switch
Function Description:
- Routes flow based on the aiTrigger.shouldTrigger value returned from the previous node
- Branch 1 (false): Enters "No Action" node, current loop ends, saving AI call costs
- Branch 2 (true): Enters "Sentiment News Fetch" node, begins AI analysis process
This node is key to cost control, ensuring AI is only called when truly needed.
Node 6: Sentiment News Fetch
Node Name: Sentiment News Fetch
Node Type: MCP Client
Function Description:
- Calls Alpha Vantage's NEWS_SENTIMENT tool
- Fetches 50 news articles from the past 24 hours for the specified trading pair
- Includes sentiment score for each news article
Tool Configuration:
            Tool: NEWS_SENTIMENT
Parameters:

tickers: CRYPTO:{{$vars.contract}}  // Read trading pair from variable
Use default configuration: Returns up to 50 news articles, time range automatically determined by API
Node 7: Results Organization
Node Name: Results Organization
Node Type: Code
Complete Code:
            // Correct n8n syntax
const inputData = $input.all();
const sentimentData = inputData[0].json;  // Get news sentiment data

// Get position data from specific node
const positionNode = $node["触发判断"].json;

// Return integrated data
return {
  timestamp: new Date().toISOString(),

  // Raw news data
  sentimentData: sentimentData,

  // Position status data
  positions: positionNode
};
Function Description:
- Integrates two data sources: news sentiment + position status
- Prepares complete input data for the AI analysis node
- Adds timestamp for convenient subsequent tracking
Node 8: AI Parameter Analysis
Node Name: AI Parameter Analysis
Node Type: Sentiment Analysis
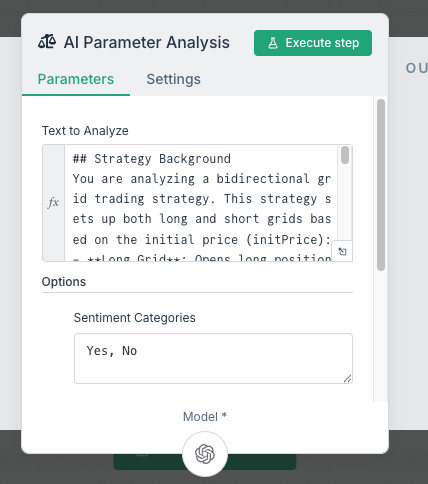
Complete Prompt Content:
            ## Strategy Background
You are analyzing a bidirectional grid trading strategy. This strategy sets up long and short grids based on the initial price (initPrice):
- **Long Grid**: Opens long positions progressively as price falls, closes for profit on rebound (1% step size)
- **Short Grid**: Opens short positions progressively as price rises, closes for profit on pullback (1% step size)
- **Maximum Positions**: 5 levels each for long and short, total of 10 positions

## Current Trigger Conditions
The system has detected one of the following abnormal situations:
1. Number of positions reaches 5 (fully positioned status)
2. Longest holding time exceeds 24 hours (position trapped)
3. When holding short positions, price breaks through grid upper limit (price continues to rise)
4. When holding long positions, price breaks through grid lower limit (price continues to fall)

## Your Analysis Task
Please make a comprehensive judgment based on the following data:

### Data 1: Position Status (positions)
{{JSON.stringify($json.positions)}}

### Data 2: Market Sentiment (sentimentData)
{{JSON.stringify($json.sentimentData)}}

## Judgment Criteria

**Situations requiring grid price adjustment:**
- Market trend is clear and sustained (news sentiment extremely bullish/bearish)
- Current price is far from initial grid range (breakthrough or breakdown exceeds 3%)
- Positions severely trapped and market sentiment doesn't support reversal
- News shows major fundamental changes (regulation, technology upgrades, major events)

**Situations not requiring adjustment:**
- Price fluctuates normally within grid range
- News sentiment is neutral or contradictory
- Short-term volatility, lacks trend confirmation
- Position floating loss is within acceptable range

**Note:**
- Must return a clear "Yes" or "No"
- Reasoning should be concise, specific, and actionable
- Judge cautiously to avoid frequent grid adjustments
Function Description:
- Uses sentiment analysis node instead of regular AI dialogue for more structured output
- Binary classification output (Yes/No), avoiding ambiguous answers
- AI Model: Large language model (called via OpenRouter)
- Also returns reasoning explanation, convenient for backtesting and optimization
AI Return Example:
            json

            {
  "sentiment": "Yes",
  "sentimentScore": 0.95,
  "reason": ...
}
Node 9: Reset Strategy
Node Name: Reset Strategy
Node Type: Code
Complete Code:
            javascript

            Log('Closing all positions, resetting all parameters')

let positions = exchange.GetPosition();

if (positions[0].Type === 0) {
    // Close long position - market sell
    const orderId = exchange.CreateOrder(positions[0].Symbol, 'closebuy', -1, positions[0].Amount);
    Log(`✓ Long position closed successfully, Order ID: ${orderId}`);
} else if (positions[0].Type === 1) {
    // Close short position - market buy
    const orderId = exchange.CreateOrder(positions[0].Symbol, 'closesell', -1, positions[0].Amount);
    Log(`✓ Short position closed successfully, Order ID: ${orderId}`);
}

_G('grid', null);
_G('initPrice', null);
_G('lastAItime', Date.now());

return {};
Function Description:
- Executes corresponding closing operations based on position type (long/short)
- Uses market orders to ensure immediate execution
- Clears all persisted grid data
- Next cycle will automatically rebuild the grid at the new price
Execution Flow:
            Current moment: Price at 35,000, all 5 long position levels opened
↓
AI judgment: Yes, adjustment recommended
↓
Execute liquidation: Close all long orders
↓
Clear data: grid=null, initPrice=null
↓
After 60 seconds: K-line trigger fires again
↓
Reinitialize: Use 35,000 as the new initial price
↓
Rebuild grid: New long and short grids unfold around 35,000
Node 10: AI CooldownNode
Name: AI Cooldown
Node Type: Code
            javascript

            Log('AI analysis does not support adjusting original price')
_G('lastAItime', Date.now())
return {};
Function Description:
- Executes when AI judgment is "No"
- Records this AI analysis time
- Current loop ends
The entire process is fully automated, from problem detection to adjustment completion, without any manual intervention required.
4. Why Is This Approach Useful?
Comparison with Traditional Methods
| Dimension | Manual Monitoring & Parameter Adjustment | Workflow + AI Automated Decision |
|---|---|---|
| Monitoring Frequency | Requires 24-hour monitoring | Auto-checks every 60 seconds |
| Response Speed | Delayed late at night/early morning | Second-level response |
| Decision Quality | Prone to emotional operations | Objective analysis combining news sentiment |
| Labor Cost | High-intensity labor | Just check logs occasionally |
Actual Operating Results
Scenario 1: Ranging Market (Normal Operation)
            8:00  - Price 39,500, open long Level 1
9:00  - Price 39,800, close long Level 1, profit 0.76%
10:00 - Price 40,300, open short Level 1
11:00 - Price 40,100, close short Level 1, profit 0.50%
...Continuous ranging, grid runs normally
→ AI monitoring indicators normal, no analysis triggered, zero extra cost
Scenario 2: Unilateral Decline (AI Intervention)
            Monday - Price drops from 40,000 to 38,000, all 5 long levels opened
Tuesday - Continues dropping to 36,000, 24-hour holding triggers AI
     → AI analysis: Market sentiment -0.65 (bearish), adjustment recommended
     → Auto-close 5 long positions, stop loss -10%+
     → Rebuild grid at 36,000, continue ranging profit
Wednesday - New grid starts operating, daily profit 1.3%
If not adjusted: The 5 long positions would remain trapped, potential loss could expand beyond -10%
Scenario 3: Sudden News Impact
            14:00 - Price normally ranging at 39,800
14:30 - Sudden regulatory negative news, price flash crashes to 37,500
14:31 - Full long position + price deviation triggers AI
       → AI fetches news: "SEC raids exchange"
       → Sentiment score plummets to -0.85
       → Judgment: Short-term reversal unlikely, adjustment recommended
14:32 - Auto-close positions and reset grid to 37,500
Traditional strategies might take days for manual problem detection
5. How to Control Costs and Frequency?
Many worry about AI call costs, but it's completely controllable:
Normal Situations
- Strategy runs on its own, no AI calls
- Analysis only starts when abnormal conditions are triggered
- Called only once during severe market volatility, costing a few cents each time
Extreme Situations
- If market fluctuates violently, AI intervenes timely for judgment
- Compared to losses avoided, it's completely worthwhile
6. What Other Creative Applications Are Possible?
This approach isn't limited to grid strategies:
1. Moving Average Strategy
- Auto-trades based on MA signals normally
- AI judges if major trend has changed
- Decides whether to adjust MA period
2. Martingale Strategy
- Traditional martingale doubling
- AI monitors risk exposure
- Decides whether to reduce leverage
3. Arbitrage Strategy
- Monitors exchange price spreads
- AI analyzes reasons for spread changes
- Adjusts arbitrage parameters
4. Multi-Asset Portfolio
- Simultaneously monitors BTC, ETH, SOL
- AI analyzes correlation between different coins
- Dynamically adjusts position allocation
7. How Should Beginners Get Started?
Step 1: Run Traditional Strategy First
- Choose a simple grid or MA strategy
- Run for a week, familiarize with basic logic
- Record problems encountered
Step 2: Add Monitoring
- Add trigger judgment code
- Record key metrics
- Set trigger conditions (use logs first, don't connect AI)
Step 3: Connect AI Decision-Making
- Set up AI node
- Write clear judgment prompts
- Let AI only give suggestions first, don't auto-execute
Step 4: Automated Execution
- Verify AI suggestion accuracy
- Enable automatic parameter adjustment
- Continuously optimize prompts and trigger conditions
8. Some Practical Recommendations
1. Write Clear Prompts
            ❌ "Help me see if I need to adjust parameters"

✅ "Currently holding 5 positions, trapped for 36 hours, market news bearish,
   My grid center price is 40,000, current price 35,000,
   Please judge whether grid parameters need adjustment"
2. Have AI Provide Reasoning
- Convenient for backtesting and verification
- Discover AI's blind spots in thinking
- Continuously optimize decision logic
3. Set Safety Boundaries
- Single adjustment amount limit
- Adjustment frequency restrictions
- Manual confirmation for important decisions
4. Record All Decisions
Save every AI decision:
- When was it triggered
- What recommendation did AI give
- What was the result after execution
Summary: The True Value of Workflows
The greatest value of FMZ platform's workflow isn't replacing traditional strategies, but making them smarter:
- ✅ Traditional strategies are stable and reliable, but lack flexibility
- ✅ AI decisions are intelligent, but can't be fully relied upon
- ✅ Combining both provides rules with adaptability
It's like pairing a diligent but rigid employee with a smart consultant. The employee handles routine work by the rules, the consultant provides advice at critical moments.
Most importantly: All this can run automatically. You don't need to monitor 24/7, nor wake up at 3 AM to adjust parameters. The strategy runs, AI watches for you, you just need to check results periodically.
This is what quantitative trading should be—humans think about the big picture, machines execute details, AI optimizes at appropriate times.
- 1