
Preface
If you've traded perpetual contracts, you've probably been liquidated at some point. At best you lose part of your position; at worst your entire principal is gone. But have you ever thought about this — the moment you get liquidated, that data point is actually recorded?
Exchanges push every forced liquidation event in real time: which token, which direction, how much notional value, and exactly when. This is liquidation data.
data
2026-03-10 13:10:19 Liquidation: {"s":"DEXEUSDT","S":"BUY","o":"LIMIT","f":"IOC","q":"30.99","p":"5.427000","ap":"5.347646","X":"FILLED","l":"17.21","z":"30.99","T":1773119419184}
2026-03-10 13:10:18 Liquidation: {"s":"BEATUSDT","S":"SELL","o":"LIMIT","f":"IOC","q":"21","p":"0.3503000","ap":"0.3573000","X":"FILLED","l":"4","z":"21","T":1773119418458}
2026-03-10 13:10:18 Liquidation: {"s":"COAIUSDT","S":"SELL","o":"LIMIT","f":"IOC","q":"35","p":"0.2968000","ap":"0.3115000","X":"FILLED","l":"35","z":"35","T":1773119418118}
2026-03-10 13:10:18 Liquidation: {"s":"AIAUSDT","S":"BUY","o":"LIMIT","f":"IOC","q":"537","p":"0.0844900","ap":"0.0823800","X":"FILLED","l":"10","z":"537","T":1773119418118}
2026-03-10 13:10:09 Liquidation: {"s":"BABYUSDT","S":"SELL","o":"LIMIT","f":"IOC","q":"1965","p":"0.0161200","ap":"0.0162300","X":"FILLED","l":"1376","z":"1965","T":1773119409616}
2026-03-10 13:10:08 Liquidation: {"s":"MBOXUSDT","S":"SELL","o":"LIMIT","f":"IOC","q":"372","p":"0.0173800","ap":"0.0178100","X":"FILLED","l":"372","z":"372","T":1773119408667}
2026-03-10 13:10:07 Liquidation: {"s":"GALAUSDT","S":"SELL","o":"LIMIT","f":"IOC","q":"23717","p":"0.00337","ap":"0.00341","X":"FILLED","l":"23717","z":"23717","T":1773119407235}
2026-03-10 13:10:04 Liquidation: {"s":"RIVERUSDT","S":"SELL","o":"LIMIT","f":"IOC","q":"17.7","p":"10.945000","ap":"11.109943","X":"FILLED","l":"3.3","z":"17.7","T":1773119404767}
2026-03-10 13:10:04 Liquidation: {"s":"ROBOUSDT","S":"SELL","o":"LIMIT","f":"IOC","q":"3000","p":"0.0445100","ap":"0.0451800","X":"FILLED","l":"3000","z":"3000","T":1773119404308}
2026-03-10 13:09:47 Liquidation: {"s":"RIVERUSDT","S":"BUY","o":"LIMIT","f":"IOC","q":"48.1","p":"11.287000","ap":"11.122577","X":"FILLED","l":"17.7","z":"48.1","T":1773119387280}
2026-03-10 13:09:45 Liquidation: {"s":"DENTUSDT","S":"SELL","o":"LIMIT","f":"IOC","q":"827079","p":"0.000253","ap":"0.000257","X":"FILLED","l":"827079","z":"827079","T":1773119385320}
2026-03-10 13:09:44 Liquidation: {"s":"BULLAUSDT","S":"SELL","o":"LIMIT","f":"IOC","q":"526","p":"0.0203300","ap":"0.0213800","X":"FILLED","l":"526","z":"526","T":1773119384220}
2026-03-10 13:09:40 Liquidation: {"s":"DENTUSDT","S":"SELL","o":"LIMIT","f":"IOC","q":"554440","p":"0.000253","ap":"0.000257","X":"FILLED","l":"289977","z":"554440","T":1773119380709}
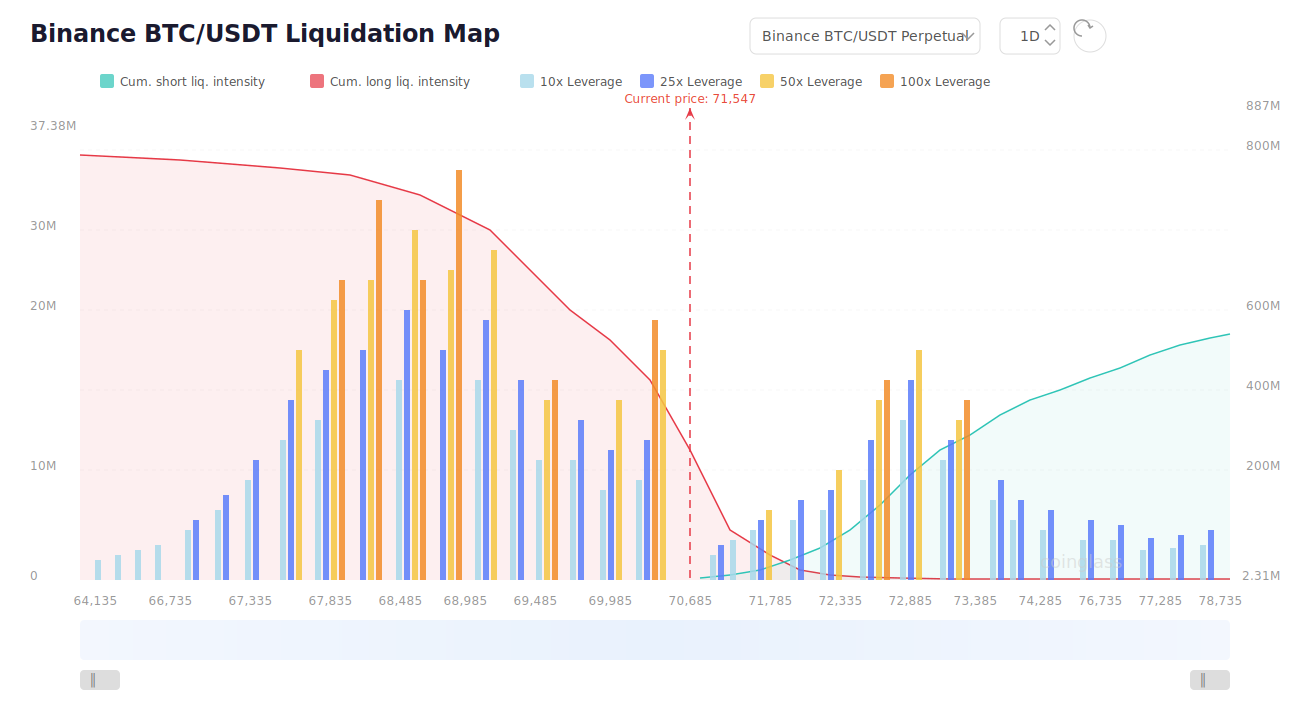
A single liquidation event doesn't mean much on its own. But when you aggregate everyone's liquidations together, something very interesting emerges — you can see where capital is under pressure in the market, and which side is already cracking. Liquidation data is widely regarded as one of the most important components of order flow analysis. It represents blood-stained chips — the rawest reaction of capital that can't be faked.
What this article sets out to do is simple: use liquidation data as the core signal, layer on candlestick verification and news judgment, let AI make the comprehensive decision, and run the whole thing through an automated workflow — 24/7, no manual chart-watching required.
1. Strategy Logic
1.1 What Liquidation Data Can Tell Us
Positions are being liquidated every moment. Normal liquidations aren't signals. What we're looking for are statistical anomalies — a token experiencing liquidation volume far above its historical baseline in a short period, indicating that weak positions on one side are being systematically wiped out.
After a liquidation cascade, the trend tends to continue. This is the core assumption of this strategy.
1.2 Why Trend-Following, Not Mean-Reversion
When facing a wave of liquidations, there are generally two approaches:
- Mean-reversion: Assume the worst is over, step in to catch the bounce
- Trend-following: Assume weak positions haven't finished clearing out, ride the direction
The risk of mean-reversion is that you don't know if the liquidation cascade is over. If longs are still being wiped out in droves and you step in to buy, it's like sticking your hand under a waterfall — what you catch isn't the bottom, it's more downside.
So this strategy chooses trend-following — when longs get liquidated, go short; when shorts get liquidated, go long.
1.3 Limitations of a Single Signal
Relying on liquidation data alone for decisions is too crude and easily thrown off by noise. So on top of the liquidation data, we add two more layers:
- Candlestick verification: Is price action confirming the liquidation direction?
- News judgment: Is there a substantive event driving this?
AI then synthesizes all three dimensions to make the final decision.
2. Overall Architecture
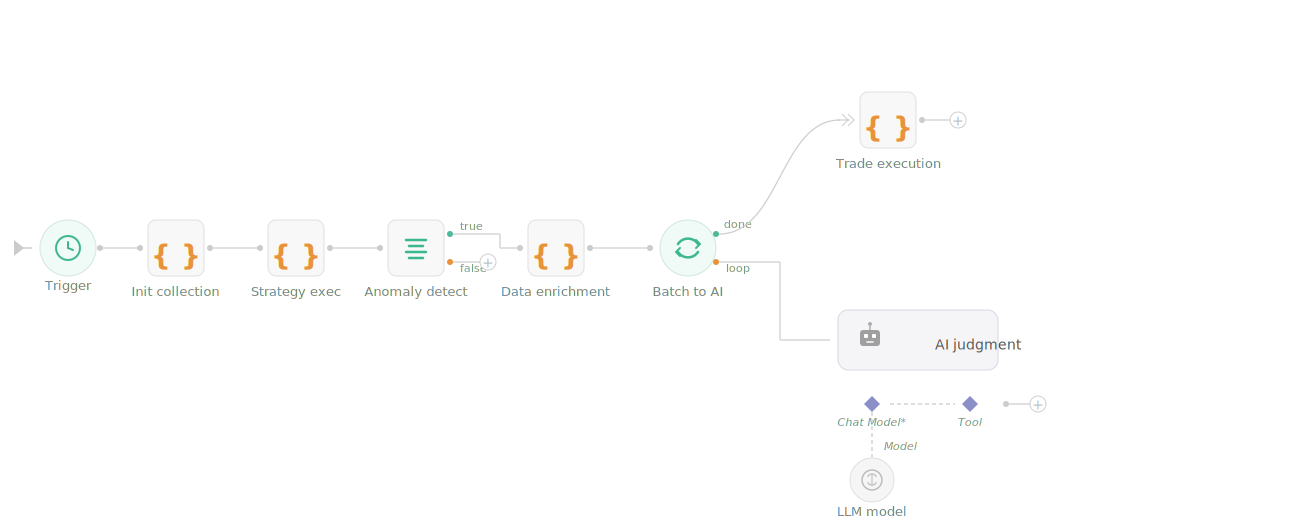
The workflow uses a linear structure, triggered at fixed intervals. The complete flow is as follows:
- After the trigger fires, first check whether initialization has been completed
- If it's the first run, enter the initialization collection node to establish historical baseline data
- Once initialization is complete, each trigger executes in sequence: collect new data → scan for anomalous signals → determine whether entry conditions are met
- If an anomaly is found, continue downstream into data enrichment, AI judgment, and trade execution nodes
- If no anomaly is found, terminate immediately and wait for the next trigger interval
The entire flow halts when conditions aren't met and continues when they are — no manual intervention needed.
3. Key Node Breakdown
3.1 Initialization Collection
On first startup, the system needs to establish historical baseline data. It connects to Binance Futures' forced liquidation push channel via WebSocket, continuously collecting liquidation data for a period and storing it in global variables.
Each data point contains four fields: timestamp, token, liquidation direction, and liquidation amount. During collection, two types of data are filtered out: partially filled forced liquidation orders, and small-amount noise data. Once collection is complete, the data is written to persistent storage and initialization is marked as done. On subsequent triggers, this node is skipped entirely.
            javascript

            // Excerpt from source code
var ws = Dial('wss://fstream.binance.com/ws/!forceOrder@arr')

while (Date.now() < endTs) {
    var msg = ws.read(1000)
    try {
        var obj = JSON.parse(msg)
        var orders = Array.isArray(obj) ? obj : [obj]
        for (var i = 0; i < orders.length; i++) {
            var item = orders[i]
            if (!item || !item.o) continue
            var o = item.o
            if (o.X !== 'FILLED') continue
            if (EXCLUDE[o.s]) continue
            if (!/USDT$/i.test(o.s)) continue       // ✅ Only process USDT contracts
            var price = parseFloat(o.ap || o.p)
            var qty = parseFloat(o.z)
            var value = price * qty
            if (value < MIN_VALUE) continue
            liquidationData.push({
                t: item.E || Date.now(),
                s: o.s,
                d: o.S,
                v: value
            })
            totalNew++
        }
    } catch(e) {}
}

_G('liquidationData', liquidationData)               // Persistent storage
_G('liqInitialized', true)                           // Mark initialization complete
3.2 Strategy Execution: Collection + Z-Score Scanning
On each trigger, new liquidation data is first collected via WebSocket and appended to the historical window, then Z-Score anomaly detection is run per token.
The core idea behind Z-Score:
Divide the baseline period's liquidation data into equal-length time segments, recording the total liquidation amount for each monitoring segment. Then take the latest monitoring segment's liquidation volume and compare it against the mean of all historical segments in the baseline period, calculating the degree of deviation. Only when the deviation exceeds the threshold is it considered anomalous.
            javascript

            // Excerpt from source code
var mean = hist.reduce(function(s, v) { return s + v }, 0) / hist.length
var std = Math.sqrt(
    hist.reduce(function(s, v) { return s + Math.pow(v - mean, 2) }, 0) / hist.length
)
var z = std > 0 ? (rec - mean) / std : 0
if (z < ZSCORE_THRESH || rec <= 0) continue
The benefit of this approach is self-adaptation: active tokens have active baselines, illiquid tokens have their own baselines — you won't get false positives just because a token naturally has high trading volume.
Volume alone isn't enough — you also need to check whether the direction is one-sided:
            javascript

            // Excerpt from source code
var longRatio = total > 0 ? st.longV / total : 0.5
var direction = null
if (longRatio > DIR_THRESH) direction = 'SHORT'       // Longs getting wiped → trend-follow short
else if (longRatio < 1 - DIR_THRESH) direction = 'LONG' // Shorts getting wiped → trend-follow long
if (!direction) continue                                // Mixed liquidations → direction unclear, skip
Both conditions must be met simultaneously for a signal to trigger: Z-Score above threshold, AND one-sided liquidation (long or short) exceeding 75%. When both sides are getting wiped equally, direction is unclear — skip entirely.
3.3 Data Enrichment: Candlesticks + News
After a signal triggers, the system doesn't open a position immediately. Instead, it enters a data enrichment node to prepare more complete context for the subsequent AI judgment.
Candlestick component:
Fetch the token's most recent 1-minute candlesticks, calculate price change and volatility, determine the current candlestick trend direction, and compare it with the liquidation signal direction to check for alignment. If the signal suggests shorting but the candlesticks are still trending up, credibility takes a hit.
News component:
Via the Brave Search API, fetch the token's latest news for the day. Liquidations driven by concrete events have a much higher probability of trend continuation; if there's no news and it's purely technical clearing, the AI will be more conservative.
Once both types of data are collected, they're sent to the AI together.
3.4 AI Comprehensive Judgment
The AI receives liquidation data, candlesticks, and news, then evaluates based on a fixed decision framework — all three dimensions are indispensable:
Decision matrix:
| Liquidation Intensity | Candlestick Aligned | News | Decision |
|---|---|---|---|
| Strong | Yes | Yes | Enter, high confidence |
| Strong | Yes | No | Enter, medium confidence |
| Strong | No | Yes | Hold/observe |
| Medium | Yes | Yes | Enter, medium confidence |
| Medium | No or None | — | Don't enter |
The AI outputs a structured result containing direction, decision, confidence level, and reasoning. Only entry signals that reach the confidence threshold will actually trigger position opening downstream.
The core of the prompt is as follows:
            ## Judgment Steps

Step 1: Liquidation Intensity
- Z-Score exceeds high threshold AND direction purity is very high → Strong signal
- Z-Score meets base threshold AND direction purity meets requirements → Medium signal
- Otherwise → Don't enter

Step 2: Candlestick Trend
- Aligned with liquidation direction → High probability of trend continuation, positive factor
- Opposite to liquidation direction → Possibly just a temporary clearing rather than a trend, negative factor

Step 3: News Verification
- Substantive bearish/bullish news aligned with direction → Positive factor
- No news → Pure technical liquidation, reduce confidence
- News contradicts direction → Don't enter

## Output Format
Return strict JSON, no markdown wrapping:
{
    "symbol": "token",
    "direction": "LONG or SHORT",
    "action": "enter/hold/don't enter",
    "confidence": "high/medium/low",
    "liq_note": "One-sentence assessment of liquidation signal",
    "trend_note": "One-sentence assessment of candlestick trend",
    "news_note": "One-sentence assessment of news",
    "action_reason": "One-sentence comprehensive reasoning"
}
3.5 Trade Execution and Stop-Loss Management
After the AI decides to enter, the trade execution node automatically opens the position while also managing stop-losses and updating the visualization dashboard.
Position opening flow:
Before opening, signals are sorted by confidence — high-confidence signals execute first. If the token already has an open position and the new signal has higher confidence, the old position is closed first and then a new one is opened; if the new signal's confidence doesn't exceed the existing position's, it's skipped. When the number of open positions reaches the cap, all subsequent signals are skipped.
Position size, leverage multiplier, and maximum number of positions are all configured via external variables. Contract quantity is dynamically calculated based on the real-time price from current market depth.
            javascript

            // Excerpt from source code
// Calculate position size
var rawQty = OPEN_MONEY * CONFIG.LEVERAGE / refPrice / mkt.ctVal
var qty = floorToStep(rawQty, mkt.amtSize, mkt.amtPrec)

// Market order entry
var side = direction === 'LONG' ? 'buy' : 'sell'
var oid = exchange.CreateOrder(swapSym, side, -1, qty)
Stop-loss mechanism:
Stop-loss uses a dual-layer mechanism with both defenses active simultaneously:
- Trailing stop: Tracks the price extreme; if the pullback from peak unrealized profit exceeds a set percentage, close the position. Let profits run, but don't give back everything already earned.
- Fallback stop: The last line of defense; if price moves against the entry by more than a set percentage, force close.
            javascript

            // Excerpt from source code
if (pos.direction === 'LONG') {
    var trailStop = pos.peak * (1 - TRAILING_PCT)           // Trailing stop price
    var fallStop = pos.entryPrice * (1 - FALLBACK_PCT)      // Fallback stop price
    effectiveStop = Math.min(trailStop, fallStop)
    if (cur <= effectiveStop) triggered = true
}
Visualization dashboard:
After each execution, three tables are updated in real time:
- Account overview: Balance, number of positions, cumulative P&L, stop-loss parameters
- Position monitor: Entry price, current price, P&L percentage, max profit, current drawdown, and stop-loss price for each position
- Latest AI signals: Liquidation signal, candlestick assessment, news assessment, and comprehensive decision for each scanned token
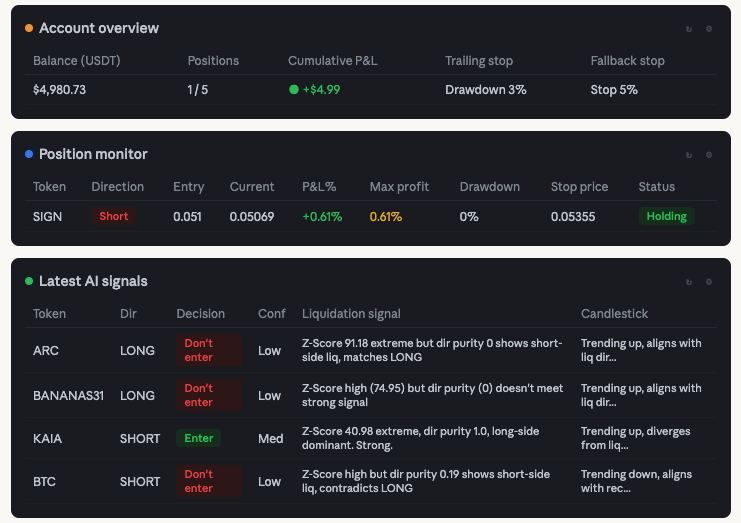
You can see what the strategy is doing at any time — no need to watch the charts.
4. Complete Flow Recap
Here's the complete logic of this strategy:
- Initialization: On first run, collect historical liquidation data to establish baselines
- Collection: On each trigger, collect new liquidation data and update the historical window
- Scanning: Use Z-Score to find tokens with statistically anomalous liquidation volumes; filter out signals with impure directionality
- Enrichment: Fetch candlestick and news data for anomalous tokens
- Judgment: AI synthesizes all three dimensions to make entry decisions
- Execution: Auto-open positions sorted by confidence, with dual-layer stop-loss and visualization dashboard throughout
This is an exploration of AI-enhanced trading built on traditional liquidation data. Liquidation data itself is the market's rawest reaction; layering on candlesticks and news effectively improves signal credibility; and the introduction of AI makes multi-dimensional decision-making automatable.
If you're interested in strategies based on on-chain or market microstructure data like this, feel free to leave feedback — further strategy development on more signal types can follow.
Strategy source code: Liquidation Map Trend-Following Strategy
Original: https://www.fmz.com/bbs-topic/10895
Author: ianzeng123 | Created: 2026-03-13 | Updated: 2026-03-18
- 1