
1. Strategy Background & Requirements
Recently, some friends asked: could we build a funding rate arbitrage strategy? Between CEX and DEX platforms, funding rates are often inconsistent, creating opportunities to collect arbitrage signals and use AI to determine whether it's worth opening a position. However, there has always been a pain point: no good tool for detecting arbitrage opportunities.
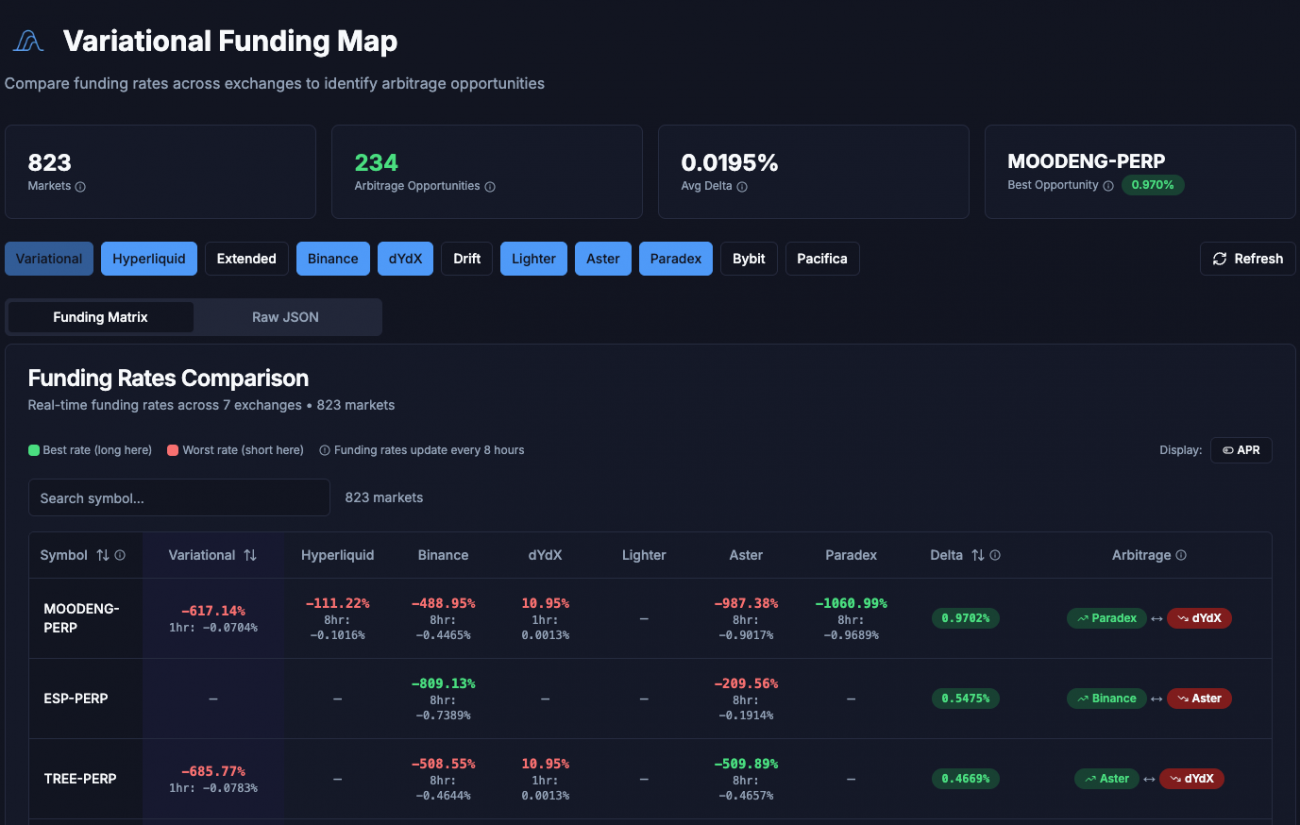
Fortunately, someone recommended the VarFunding platform. This platform collects real-time funding rate data from multiple exchanges, including Binance, Hyperliquid, Lighter, Bybit, and more — all of which are already supported on the FMZ Quant platform. More importantly, it compares funding rate data in real time and provides optimal arbitrage opportunity combinations.
Talk about perfect timing! Today, let's walk through the design of this funding rate arbitrage strategy step by step.
2. What Is Funding Rate Arbitrage?
Before diving into the strategy, let's clarify: what exactly is funding rate arbitrage?
Perpetual contracts have a mechanism called the funding rate. Settlement cycles vary by exchange — some settle every 8 hours, some every 4 hours, and some even every hour.
- When the rate is positive: longs pay shorts
- When the rate is negative: shorts pay longs
Different exchanges have different user structures and liquidity profiles, resulting in different long/short dynamics. This means the funding rate for the same token often differs across exchanges.
The Arbitrage Principle
For example, Exchange A has a BTC funding rate of +0.1%, while Exchange B has +0.05%.
In this case, we can:
- Go short on Exchange A (collect the 0.1% rate)
- Go long on Exchange B (pay the 0.05% rate)
The positions hedge each other — price movements cancel out — but the rate differential (0.05%) goes straight into your pocket.
This is the core logic of funding rate arbitrage: you earn the rate spread, not price movement.
3. Why Use a Workflow?
Now that we understand the principle, the next question is: how do we implement it?
The traditional approach is to write a complete program, but this time we chose to implement it using a workflow. Workflows have several unique advantages:
1. Modular Design
Each node handles an independent function — data collection, filtering, AI evaluation, execution — each with a clear role, making debugging and modification straightforward.
2. Visual Representation
The entire strategy's execution flow is visible at a glance, making it easy to quickly locate any issues.
3. Flexible Extensibility
Want to swap in new filtering criteria or optimize trading logic? Just modify the corresponding node without touching other parts.
4. Easy AI Integration
Workflows natively support calling large language models, making it simple to incorporate AI into the decision-making process.
For an arbitrage strategy that requires multiple data sources and multi-step processing, workflows are an excellent implementation approach.
4. Overall Strategy Architecture
This strategy has two main pipelines:
Pipeline 1: Trade Execution (Hourly Interval)
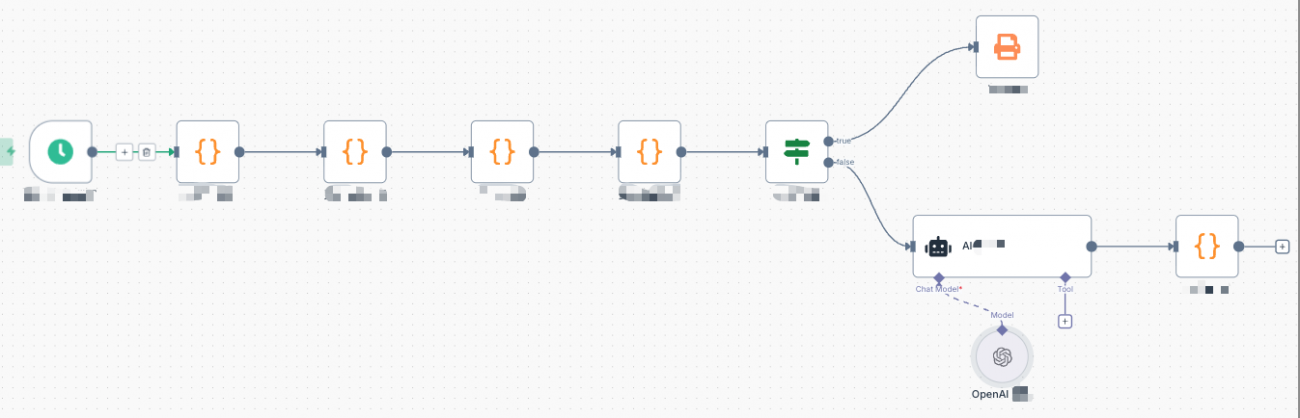
- Exchange Initialization → Build exchange mappings
- Rate Data Analysis → Analyze historical data stability
- Close Position Detection → Check if existing positions need to be closed
- Rate Data Verification → Verify spread stability and liquidity
- AI Smart Evaluation → Comprehensive assessment of opening opportunities
- Open Position Execution → Execute arbitrage trades
Pipeline 2: Rate Collection (Minute Interval)

- Fetch Arbitrage Opportunities → Pull data from VarFunding
- Data Filtering → Filter opportunities that meet criteria
- Data Storage → Save historical snapshots
- Visualization → Display account and position status
The two pipelines each serve their purpose: the execution pipeline handles decisions and trades, while the collection pipeline handles data gathering and display. This design allows the strategy to execute efficiently while maintaining real-time awareness of its operational state.
5. Configuration Parameters
The strategy has several key parameters to configure:
- Exchange: Exchange list — determines which exchanges the strategy searches for arbitrage opportunities between, e.g.,
['binance', 'hyperliquid', 'lighter'] - Confidence: Confidence filter — determines which confidence levels qualify for the verification process, options:
['high', 'medium', 'low'] - Amount: Per-trade position size — AI will adjust the actual amount based on risk level
These parameters can be flexibly configured based on your needs.
6. Data Collection & Filtering
The first step is fetching arbitrage opportunity data. The strategy sends an HTTP request to VarFunding's API endpoint with the configured exchange list:
javascript
const url = `https://varfunding.xyz/api/funding?exchanges=${exchangeList.join(',')}`;
The platform returns funding rate data for all tokens across all exchanges, along with pre-calculated optimal arbitrage combinations. However, the raw data is too extensive to use entirely. The strategy filters it, keeping only opportunities where both the long and short exchanges are in our configured list:
            javascript

            const filteredMarkets = data.data.markets.filter(market => {
    const bestExchange = market.bestRate?.exchange;
    const worstExchange = market.worstRate?.exchange;
    return exchangeList.includes(bestExchange) && exchangeList.includes(worstExchange);
});
The filtered data is extracted into a concise format, retaining only key information: trading pair, long exchange, short exchange, rate spread, estimated annualized return, and confidence level. This data is saved for subsequent arbitrage opportunity analysis.
7. Rate Stability Verification
A single snapshot of rate data isn't sufficient, since rates may fluctuate temporarily. The strategy continuously collects data snapshots, saving current rate data every minute and retaining only the most recent N hours of historical records.
Once enough samples accumulate, the strategy performs statistical analysis, calculating the frequency of each token appearing at different confidence levels:
            javascript

            const stats = {};
for (const snapshot of savedData) {
    for (const [baseAsset, info] of Object.entries(snapshot.data)) {
        if (!stats[baseAsset]) {
            stats[baseAsset] = { high: 0, medium: 0, low: 0, total: 0 };
        }
        stats[baseAsset].total++;
        if (info.confidence === 'high') stats[baseAsset].high++;
        // ... tally other confidence levels
    }
}
Tokens are then categorized by their most frequent confidence level, and a weighted score is calculated:
            javascript

            score = (highCount × 3 + mediumCount × 2 + lowCount × 1) / totalCount
This score reflects the stability of the arbitrage opportunity. A higher score indicates more consistent performance in historical data, making the opportunity more trustworthy.
8. Close Position Detection
After rate analysis, the strategy checks existing positions against the latest arbitrage opportunity list. The core logic involves scanning all exchanges for current positions:
            javascript

            function scanAllPositions() {
    const allPositions = {};
    for (const [exName, exIndex] of Object.entries(EXCHANGE_MAP)) {
        const positions = exchanges[exIndex].GetPositions();
        for (const pos of positions) {
            const baseAsset = pos.Symbol.match(/^([A-Z0-9]+)_/)[1];
            const isLong = pos.Amount > 0;
            // Record long/short position info
        }
    }
    return allPositions;
}
Then it determines which positions need to be closed. There are two scenarios:
Scenario 1: The arbitrage opportunity has disappeared. If a held position's token is no longer found in the latest opportunity list, it means the rate spread has converged and the position should be closed to lock in profits.
Scenario 2: The direction has reversed. For example, if the original position was long on Exchange A and short on Exchange B, but now the optimal direction is reversed, the old positions need to be closed first.
When closing positions, both sides are closed simultaneously:
            javascript

            // Close long position
exchanges[longExIndex].CreateOrder(symbol, "closebuy", -1, amount);
// Close short position
exchanges[shortExIndex].CreateOrder(symbol, "closesell", -1, amount);
Position records are then cleared, ensuring that any expired positions are handled before searching for new opportunities.
9. In-Depth Rate Data Verification
After close position detection, the strategy performs live verification on the filtered arbitrage opportunities. Verification covers two aspects:
1. Spread Stability Verification
By fetching K-line data from both exchanges, historical spreads are calculated:
            javascript

            // Fetch 240 candlesticks
const recordsLong = EX_Long.GetRecords(symbol, PERIOD_M1, 240);
const recordsShort = EX_Short.GetRecords(symbol, PERIOD_M1, 240);

// Calculate spreads
const spreads = [];
for (const time of commonTimes) {
    const midPrice = (priceMapLong[time] + priceMapShort[time]) / 2;
    const spread = (priceMapLong[time] - priceMapShort[time]) / midPrice;
    spreads.push(spread);
}

// Statistical metrics
const avgSpread = mean(spreads);
const range = max(spreads) - min(spreads);
const stdDev = standardDeviation(spreads);
These metrics reflect the consistency of price movements between the two exchanges. If spread volatility is too high, the risk is elevated.
2. Liquidity Detection
Real-time market data is fetched to calculate trading costs:
            javascript

            const tickerLong = EX_Long.GetTicker(symbol);
const tickerShort = EX_Short.GetTicker(symbol);

// Bid-ask spread (reflects depth)
const longSpread = (tickerLong.Sell - tickerLong.Buy) / tickerLong.Last;
const shortSpread = (tickerShort.Sell - tickerShort.Buy) / tickerShort.Last;

// Opening cost (buy on Long exchange, sell on Short exchange)
const openCost = (tickerLong.Sell - tickerShort.Buy) / midPrice;

// Closing cost (buy on Short exchange, sell on Long exchange)
const closeCost = (tickerShort.Sell - tickerLong.Buy) / midPrice;

// Round-trip cost
const roundTripCost = openCost + closeCost;
If the round-trip cost is too high, it will erode rate profits, making the opportunity not worth pursuing.
After verification, if there are no viable arbitrage opportunities (i.e., the data object is empty), the process ends. If there are new opening opportunities, they proceed to the AI evaluation stage.
10. AI Smart Evaluation
Verified opportunities are handed to AI for comprehensive evaluation. We use a carefully crafted prompt that instructs the AI to think like a professional arbitrage analyst.
The AI analyzes several dimensions:
1. Risk-Reward Ratio
Whether rate income can cover spread volatility risk. The core judgment logic:
            pseudocode

            If rateSpread (per 8-hour income) > range × 0.3
This means even in extreme spread scenarios, 1-2 settlement cycles can cover the risk
2. Spread Direction
If the average spread is negative and the long position is on the lower-priced exchange, you can buy at the cheaper price when opening — a favorable entry condition.
3. Liquidity Assessment
Whether trading volume on both exchanges is sufficient and whether bid-ask spreads are reasonable. If any exchange has 24-hour volume below $100,000, or a bid-ask spread exceeding 0.3%, liquidity may be insufficient.
4. Cost Efficiency
Whether round-trip trading costs can be recovered by rate income within a reasonable timeframe:
            pseudocode

            If roundTripCost < rateSpread × 2
This means 2 settlement cycles (16 hours) can cover trading costs
The AI scores each opportunity (0–100) and assigns a risk level (low/medium/high). Only opportunities meeting the score threshold are executed. Additionally, the AI recommends position sizes based on risk level:
- Score ≥ 80 and low risk: Suggested amount × 100%
- Score 70–79 or medium risk: Suggested amount × 80%
- Score 60–69: Suggested amount × 60%
- Score < 60: Not recommended
The AI outputs a JSON array where each element contains: whether to open, score, suggested amount, risk level, and decision rationale.
11. Position Opening Execution Flow
After AI approval, the strategy executes the opening. The execution flow is rigorous:
1. Calculate Contract Quantity
Based on the suggested amount and current price, calculate how many contracts to open:
            javascript

            const currentPrice = getCurrentPrice(ex, symbol);
const contractAmount = amountUSD / currentPrice / ctVal;
Where ctVal is the contract face value, which may differ across exchanges.
2. Set Leverage
Attempt to set the target leverage (default 10x), falling back to lower levels if unsupported:
            javascript

            const leveragesToTry = [10, 5, 3, 2, 1];
for (let lev of leveragesToTry) {
    const result = ex.SetMarginLevel(symbol, lev);
    if (result === true) {
        return lev; // Successfully set
    }
}
3. Place Order & Confirm
After placing the order, don't assume success — wait for fill confirmation:
            javascript

            const orderId = ex.CreateOrder(symbol, 'buy', -1, contractAmount);

// Poll order status
for (let i = 0; i < 20; i++) {
    const order = ex.GetOrder(orderId);
    if (order.Status === ORDER_STATE_CLOSED) {
        // Fully filled
        break;
    }
    Sleep(500);
}
4. Verify Position
Even if the order shows as filled, verify the actual position:
            javascript

            const position = getPosition(ex, symbol);
if (!position || Math.abs(position.Amount) === 0) {
    // Order filled but no position — opening failed
    return { success: false };
}
5. Exception Handling
If only one side opens successfully (e.g., long succeeds but short fails), the strategy automatically closes the opened position:
            javascript

            if (!results.short.success && results.long.success) {
    // Attempt to close the long position
    const pos = getPosition(longEx, longSymbol);
    executeClose(longEx, longSymbol, true, pos.Amount, longExchange);
}
This prevents unhedged exposure, ensuring the arbitrage's hedged nature is maintained.
After successful opening, the strategy saves arbitrage position information — including open time, price, quantity, etc. — for subsequent close detection.
12. Visual Monitoring Dashboard
During operation, all information is displayed in real time on a monitoring dashboard with five tables: the Account Overview shows each exchange's balance, frozen funds, total equity, and P&L summary; the Arbitrage Signals table presents currently detected arbitrage opportunities, execution status, and failure reasons; the Opening Decision Details log the AI's score, risk level, and rationale for each opportunity; the Live Arbitrage Positions display current arbitrage combinations, long/short P&L, and holding duration; and the Arbitrage Profit Statistics summarize today's, this week's, this month's, and cumulative arbitrage profits and returns.
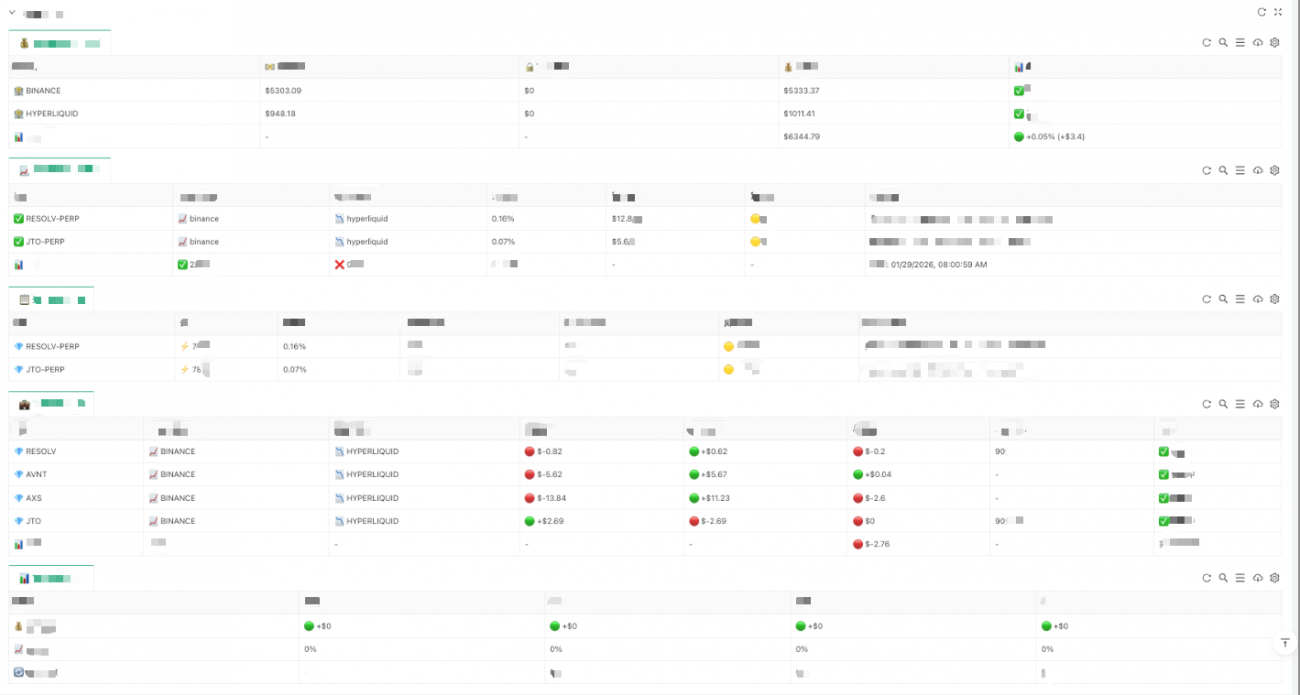
Through these dashboards, you can monitor the strategy's operational status in real time, including account health, current opportunities, position P&L, and all other key information.
13. Risks & Considerations
Finally, let's discuss risks and considerations:
1. Spread Volatility Risk
Although funding rate arbitrage is a hedged strategy, it is not risk-free. The spread between two exchanges can fluctuate, and if the fluctuation exceeds the rate income, losses will occur. This is why the strategy verifies spread stability.
2. Liquidity Risk
If an exchange lacks sufficient liquidity, slippage during opening and closing can be significant. For example, if order book depth is insufficient, your market orders may fill at poor prices, resulting in actual opening costs far exceeding expectations.
3. Exchange Risk
This is especially relevant for newer DEXs, which may have smart contract vulnerabilities or liquidity dry-up issues. There have been cases where DEX users lost funds due to smart contract bugs.
4. Capital Efficiency
This strategy requires funds on multiple exchanges. For example, if arbitraging across 3 exchanges, capital must be split three ways, resulting in relatively low capital efficiency.
It's recommended to start with a small amount, familiarize yourself with the strategy's logic, and then gradually increase your commitment. Start by arbitraging between two major exchanges, then expand to more after gaining experience.
14. Summary & Outlook
Today we introduced this funding rate arbitrage strategy based on the VarFunding platform. It implements a complete pipeline from data collection, stability verification, AI evaluation, to automated execution, with clear visual monitoring.
The core philosophy of the strategy:
- Data-driven opportunity discovery: Decisions are based on real-time rate data and historical statistics, not guesswork
- AI-assisted decision making: Large language models evaluate risk and reward, avoiding subjective human judgment
- Rigorous execution flow for risk control: From order confirmation to position verification, every step includes checks
Of course, this is just a foundational framework with plenty of room for optimization:
- Add more exchanges: Currently supported exchanges are limited; expand to more platforms
- Optimize statistical logic: Introduce more sophisticated time series analysis to predict rate trends
- Improve AI evaluation: Let AI learn from historical arbitrage successes and failures to continuously optimize decisions
- Dynamic parameter adjustment: Automatically adjust position sizes and risk thresholds based on market volatility
The complete code is publicly available on the FMZ Quant platform: Workflow Funding Rate Arbitrage Strategy. Feel free to use and improve it.
- 1