

Introduction: The Rotation Game in Crypto
The cryptocurrency market tells a different story every day. Today Bitcoin leads the rally, tomorrow Ethereum takes over, and the day after, even a lesser-known coin like ZEC might turn green. Various cryptocurrencies take turns rising or falling, with hotspots switching so fast it's hard to keep up. For institutions, they have professional teams monitoring the market 24/7 and insider information to position themselves in advance. But for retail traders, this overwhelming rotation often means either missing opportunities or chasing highs and getting trapped.
Traditional rotation strategies are actually quite classic in finance—institutions use them for sector rotation and asset rotation with good results. The problem is that traditional rotation requires macro vision: you need to judge which sector will rise and when to switch. For retail traders without insider information and slower reaction times, it's basically guesswork, and you can imagine the success rate.
So what if we let AI handle this? It can monitor technical indicators, scrape news, and analyze positions 24/7 without making impulsive decisions due to emotional fluctuations. Today, I'll use FMZ Quant Platform's workflow to implement such an AI rotation system and share the complete implementation logic with everyone.
System Architecture: Three-Layer Decision Mechanism
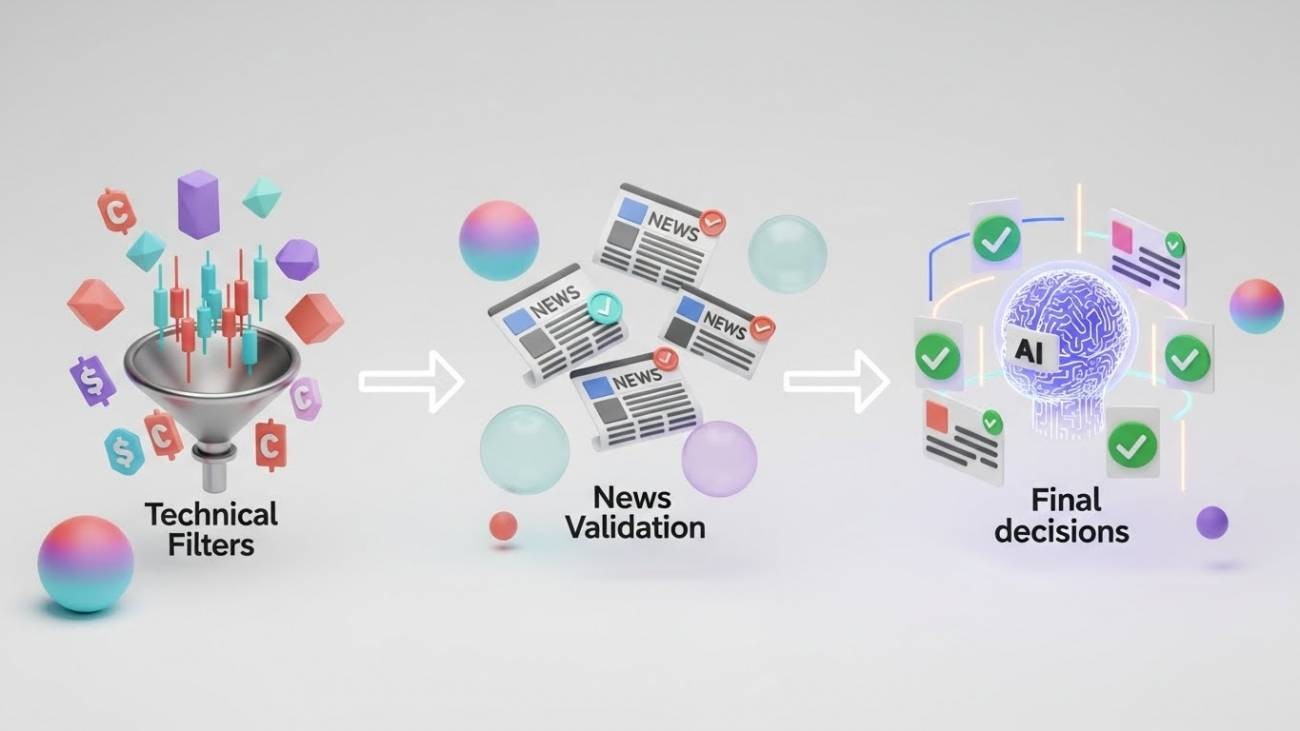
The core design philosophy of this AI rotation system is: let technical indicators do the screening, let news analysis do the verification, and let AI make the final call. The entire system is divided into three core modules:
1. Technical Screening Layer: Multi-Period Moving Average Composite Scoring
The system first scores each cryptocurrency from high-liquidity coins (sorted by 24-hour trading volume) through a multi-period moving average system. This scoring system includes three dimensions:
Moving Average Arrangement Pattern (arrangementScore: -4 to +4)
- Calculates the relative positions of four moving averages with different periods (short-term, medium-short, medium-long, long-term)
- Perfect bullish arrangement (short > medium-short > medium-long > long) scores +4
- Perfect bearish arrangement scores -4
- Other situations are assigned intermediate scores based on arrangement completeness
Moving Average Spread Gap (gapScore)
- Measures whether the distance between moving averages is expanding or contracting
- Positive values represent upward expansion (bullish trend acceleration)
- Negative values represent downward expansion (bearish trend acceleration)
Moving Average Time Series Change (timeSeriesScore: -4 to +4)
- Counts how many of the four moving averages are rising and how many are falling
- All rising scores +4, all falling scores -4
Final Composite Score Formula:
score = gapScore × arrangementScore × timeSeriesScore
The beauty of this formula is: only when all three indicators resonate together will the score be significant. If the moving average arrangement is good but the spread gap is contracting, it indicates the trend is weakening, and the score won't be too high.
1. Multi-Period Design
            javascript

            var s = exchange.GetRecords(processedSymbol, wheelPeriod / 4);   // Short-term
var ms = exchange.GetRecords(processedSymbol, wheelPeriod / 2);  // Medium-short
var ml = exchange.GetRecords(processedSymbol, wheelPeriod * 2);  // Medium-long
var ls = exchange.GetRecords(processedSymbol, wheelPeriod * 4);  // Long-term
If wheelPeriod = 60 minutes, the actual periods are: 15 minutes, 30 minutes, 120 minutes, 240 minutes, covering short, medium, and long-term trends.
2. Arrangement Pattern Scoring Logic
            javascript

            if (bullCount == 3) {
    arrangementScore = 4;    // Perfect bullish arrangement
} else if (bearCount == 3) {
    arrangementScore = -4;   // Perfect bearish arrangement
} else if (bullCount == 2) {
    // Consecutive conditions score higher
    if ((compare1 > 0 && compare2 > 0) || (compare2 > 0 && compare3 > 0)) {
        arrangementScore = 3;
    } else {
        arrangementScore = 2;
    }
}
The design here is: consecutive moving average arrangements score higher than scattered arrangements because consecutive arrangements represent clearer trends.
3. Non-Linear Design of Composite Score
            javascript

            if (gapScore > 0) {
    comprehensiveScore = gapScore * arrangementScore * timeSeriesScore;
} else if (gapScore < 0) {
    comprehensiveScore = gapScore * Math.abs(arrangementScore) * Math.abs(timeSeriesScore);
}
This design ensures:
- Only when spread, arrangement, and time series all resonate will the score be significant
- If any indicator is 0 or close to 0, the composite score will be low
- Avoids single indicator misleading
The system automatically screens out two groups of cryptocurrencies:
- Positive group: Top 5 highest scores, suitable for going long
- Negative group: Bottom 5 lowest scores, suitable for going short
But there's a key design here: if you already hold a long position in a coin, even if it's not in the top 5, the system will add it to the positive group; same for short positions. This is to allow AI to continuously monitor your positions and determine whether stop-loss or reversal is needed.
2. News Verification Layer: Fundamental Auxiliary Judgment
Technical signals alone aren't enough—we also need to know why the market is moving this way. The system automatically fetches the 5 most recent news items for each cryptocurrency (via CryptoCompare API), which could be project developments, institutional movements, regulatory news, etc.
The role of news is to verify the reliability of technical signals:
- Resonance: Technical bullish + positive news → Signal strengthened
- Contradiction: Technical bullish + major negative news → Risk warning
- Neutral: Technical bullish + irrelevant news/no news → Pure technical judgment
Note that news fetching may have delays or gaps (API limitations, obscure coins, etc.). But the system's design principle is: news is auxiliary, not mandatory. If news is missing, AI will note "News missing, pure technical judgment" and make decisions based on technical indicators and position status.
3. AI Decision Layer: The Last Line of Defense
This is the soul of the entire system. AI is not the main strategy executor but a supervisory advisor—providing a second layer of judgment at critical moments, identifying risks that technical signals cannot capture.
The system tells AI all the following information:
- Technical indicators (score, arrangement pattern, spread gap, etc.)
- News summary (list of headlines)
- Position status (no position / holding long / holding short / opposite position)
- P&L status (if holding positions)
AI needs to handle three core scenarios:
Scenario 1: No Position → Determine Whether to Open
| Technical Signal Strength | News Sentiment | Risk | AI Decision |
|---|---|---|---|
| Strong (abs(score) > 0.05) | Supportive/Neutral/No news | None | Open Long/Short |
| Strong | Contradictory | None | Wait |
| Weak (< 0.02) | Any | None | Wait |
Scenario 2: Same-Direction Position → Determine Whether to Continue Holding
"Same-direction" here means the position direction is consistent with the technical signal (e.g., holding long while technicals show bullish). The system will specifically note "Holding long but indicator strength not in top ranks," meaning this long position is still on the bullish list but no longer in the top 5—the trend is weakening.
| Signal Status | News Sentiment | P&L | AI Decision |
|---|---|---|---|
| In Top/Bottom 5 | Stable/Supportive/No news | Any | Hold |
| In Top/Bottom 5 | Turning/Negative | Profit | Close |
| Not in top ranks | Stable/No news | Profit | Hold (Observe) |
| Not in top ranks | Stable/No news | Loss | Close (Stop-loss) |
| Not in top ranks | Turning/Negative | Any | Close |
Scenario 3: Opposite Position → Determine Whether to Close/Reverse
This is the core value scenario of AI as supervisor. Opposite position means the position direction is contrary to the technical signal (e.g., holding long but technicals have turned bearish).
| abs(score) | News Sentiment | AI Decision |
|---|---|---|
| Strong (> 0.05) | Confirms reversal | Reverse (Close then open opposite) |
| Strong (> 0.05) | Neutral/No news | Reverse |
| Strong (> 0.05) | Contradictory | Close (Conservative when technicals and news conflict) |
| Medium (0.02-0.05) | Confirms reversal | Reverse |
| Medium (0.02-0.05) | Neutral/No news | Close (Signal not strong enough) |
| Medium (0.02-0.05) | Contradictory | Close |
| Weak (< 0.02) | Any | Hold (Observe, signal too weak) |
Strict conditions for reversal operations (must satisfy all):
- abs(score) > 0.05 (strong signal)
- News clearly supports the opposite direction, or neutral/no news (but if news contradicts, only close position)
- No major risks (such as regulatory crackdowns, hacker attacks)
When direction is wrong, correct it: Strong signal + confirmed reversal = decisively reverse; Strong signal + news contradiction = conservatively close; Medium signal = only reverse when news confirms, otherwise close; Weak signal = continue observing, no rush to act.
AI output decision format:
            json

            [
    {
        "symbol": "BTCUSDT",
        "currentPosition": "No position",
        "score": 0.0856,
        "newsAnalysis": "Institutional accumulation, ecosystem expansion",
        "overallJudgment": "Strong technical bullish, news supportive, open long",
        "decision": "Open Long"
    },
    {
        "symbol": "ETHUSDT",
        "currentPosition": "Holding short",
        "score": 0.0623,
        "newsAnalysis": "Staking increase, capital inflow",
        "overallJudgment": "Opposite position losing, technicals turned bullish, stop-loss",
        "decision": "Close"
    }
]
Trade Execution: Fixed Amount Risk Management
After AI provides decisions, the system automatically executes trades. Here we use a fixed amount trading mechanism:
Suppose you set each trade at 100 USDT. Regardless of whether the coin's price is 100 or 10,000, the system calculates how many contracts to open based on 100U. Calculation formula:
Contract Quantity = Amount (U) / Current Price / Contract Value (CtVal)
Example:
- BTC Price = 45,000 USDT
- Contract Value = 0.001 BTC
- Fixed Amount = 100 USDT
- Contract Quantity = 100 / 45,000 / 0.001 ≈ 2.22 contracts
The system automatically handles:
- Quantity precision (rounded according to exchange requirements)
- Minimum/maximum quantity limits
- Leverage settings (default 10x)
Two benefits of this approach:
- Equal risk exposure: The risk for each coin is the same—you won't lose a tiny bit on some coins and a large amount on others due to price differences
- Simple capital management: 10 positions = 1,000U risk exposure, clear at a glance
Independent Risk Control: Trailing Stop System
After trade execution, risk control is still needed. This system uses an independently running trailing stop, separated from the main strategy, checking positions at high frequency (once per second).
Trailing stop is not a simple fixed stop-loss, but: protect floating profits and let profits run.
Workflow:
- System records the historical peak profit for each position
- Real-time calculation of current profit
- Calculate drawdown = Peak profit - Current profit
- If drawdown exceeds threshold (e.g., 1.5%), automatically close position
Code Implementation:
            javascript

            function monitorPositionWithTrailingStop(coin) {
    const pos = getPosition(coin);    // Get position
    if (!pos) return;

    const currentPnl = calculatePnl(pos);    // Current P&L percentage

    // Get historical peak profit
    const symbolKey = `${coin}_USDT.swap_maxprofit`;
    let maxProfit = _G(symbolKey);

    // If current profit is higher, update peak profit
    if (maxProfit === null || currentPnl > maxProfit) {
        maxProfit = currentPnl;
        _G(symbolKey, maxProfit);
        Log(`📈 ${coin} Updated peak profit: ${(maxProfit * 100).toFixed(2)}%`);
    }

    // Calculate drawdown
    const drawdown = maxProfit - currentPnl;

    // Trigger stop-loss
    if (drawdown >= CONFIG.TRAILING_STOP_PERCENT) {
        closePosition(coin, pos, "Trailing Stop");
        _G(symbolKey, null);    // Clear record
    }
}
Because crypto volatility is fast, the main strategy might only run once every 4 hours (re-screening coins, judging open/close positions), but stop-loss needs real-time protection. If you wait 4 hours to check, profits might have already been given back. So the stop-loss system is an independent workflow, running every 15 seconds in parallel with the main strategy.
Visual Monitoring: Three Tables to Keep You Informed
The strategy is running automatically, but you need to know what it's doing. The system has designed three monitoring tables:
1. Account Overview Table
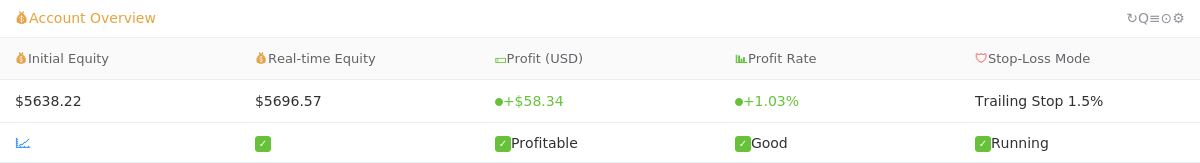
See overall P&L and system status at a glance.
2. AI Decision Signal Table (Most Important)
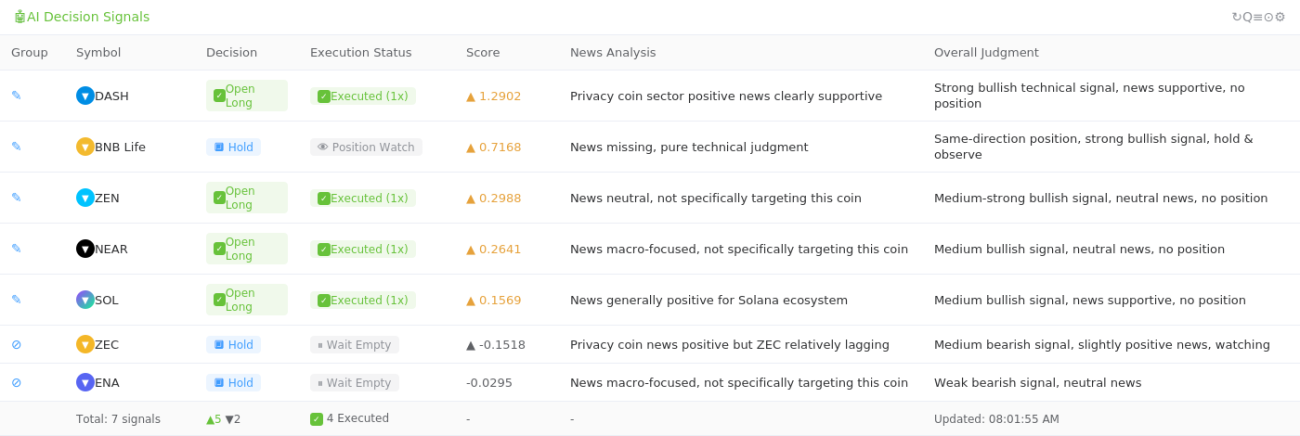
This table tells you:
- What advice AI gave
- Why it gave this advice (news + judgment)
- Whether it was executed / why it was skipped
3. Real-Time Position Table
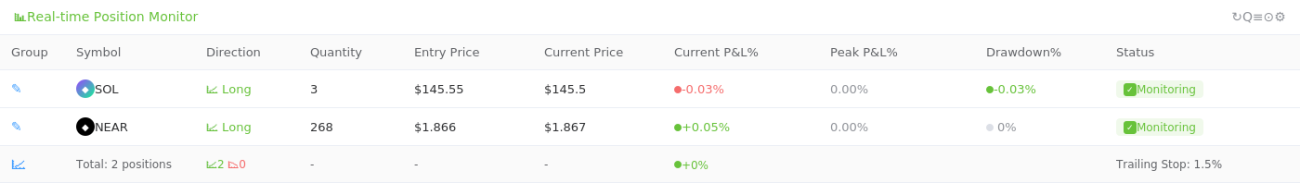
This table shows:
- Real-time P&L for each position
- Historical peak profit (where the peak was)
- Current drawdown (how far from the stop-loss line)
- Color warnings (turns red when drawdown approaches stop-loss line)
Through these three tables, you can always see what the system is doing, why it's doing it, and how effective it is.
System Limitations: Maintain Clear Awareness
No strategy is perfect, and this system has obvious limitations:
1. AI Quality Depends on the LLM
While large language models are very powerful and perform well most of the time, they may misjudge during extreme market conditions.
Examples:
- During the 2022 FTX collapse, technicals still showed bullish, and news initially had no clear negative signals (because news spreads with delay)—AI might have advised holding or adding positions
- Some "front-running" operations with sudden pumps or dumps in technicals that AI cannot identify
After all, AI learns from historical data. When encountering unprecedented situations (black swans), it may also be confused.
2. News Fetching Has Delays
The system fetches public news APIs. Major news might not be captured in the first few minutes after release, and by the time it's captured, prices may have already changed.
Examples:
- An exchange announces delisting a coin, price crashes 30% within 1 minute of the announcement, but API might only capture the news 5 minutes later
- Regulatory authority makes a sudden announcement, crypto media hasn't reported it yet, so it's not in the API
This is a common problem for all automated systems—insider information is always faster than public information.
3. Technical Indicators Are Inherently Lagging
Moving averages and trends are all calculated from historical prices; reactions to sudden events are always half a beat slow.
Examples:
- BTC drops from 45,000 to 30,000, moving averages might still show bullish arrangement (because it takes time to react)
- A coin suddenly pumps 50%, moving averages might not have turned bullish yet
So this system is better suited for following trends, not catching turning points. Its advantage is stable following after trends form, but it cannot bottom-fish or top-escape.
4. Fixed Amount May Not Be Flexible Enough
While fixed amount trading is risk-controllable, it also means:
- Cannot compound in bull markets (still 100U each time)
- Cannot reduce positions in bear markets (still 100U each time)
If the account grows from 10,000U to 50,000U, theoretically the trading amount per trade should increase, but the system won't automatically adjust. You need to manually modify the $vars.Amount variable.
How to Use This System?
1. Prerequisites
- FMZ Quant Platform account: https://www.fmz.com
- Exchange API: Exchange supporting futures trading (e.g., Binance, OKX)
- LLM credentials: Various LLM API interfaces / OpenRouter account
2. Deployment Steps
- Create a bot on FMZ platform and bind exchange API
- Copy the strategy source code
- Set trigger periods: first one determines rotation period, second one determines profit/loss check period
- Configure workflow variables:
coinNumber: Number of high-liquidity coins to screenwheelPeriod: Moving average calculation period parametermeanPeriod: Moving average periodAmount: Trading amount per tradelossPercent: Trailing stop percentage
- Configure AI LLM credentials and select the model
- Start the strategy
Strategy Optimization Directions
This system has many areas that can be improved:
1. Dynamic Position Sizing
Currently uses fixed amount. Can be changed to:
- Dynamically adjust based on account equity (e.g., 2% of equity)
- Allocate positions based on signal strength (strong signals get more, weak signals get less)
2. Multi-AI Model Voting
Don't rely on a single LLM. Instead, use 3-5 models to judge simultaneously:
- DeepSeek
- Claude
- GPT
- Gemini Pro
Only execute trades when the majority of models agree, reducing single-model misjudgment risk.
3. On-Chain Data Integration
Besides price and news, can also add:
- Whale address movements
- Exchange net inflow/outflow
- Stablecoin supply changes
This data often reflects trend changes earlier than technical indicators.
4. Smarter Stop-Loss
Current trailing stop uses fixed percentage. Can be optimized to:
- Volatility-adaptive (1.5% for BTC, 3% for altcoins)
- Time-decay stop-loss (the longer the holding period, the more relaxed the stop-loss line)
- Drawdown acceleration judgment (if rapid drawdown, close immediately)
5. Equity Curve Analysis
Record P&L for each trade and analyze:
- Which coins have higher win rates
- Which time periods perform better
- Which signal strengths are more reliable
Use historical data to reversely optimize parameters.
Conclusion: Strategy Is Just a Tool
At this point, the complete logic of this AI rotation system has been introduced. From technical screening to news verification, from AI decision-making to trade execution, from trailing stops to visual monitoring—each component has its design philosophy.
But I must emphasize again: any strategy is just a tool. The market is complex with too many unpredictable factors.
What this system CAN do:
- Help you monitor the market 24/7 without missing opportunities
- Use three layers of filtering (technicals + news + AI) to reduce impulsive trading
- Use fixed amounts and trailing stops to control risk
- Free you from screen-watching, giving you more time to think and live
What this system CANNOT do:
- Predict the future (there is no holy grail)
- Avoid black swans (extreme market conditions will cause failure)
- Guarantee profits (strategies have cycles, with highs and lows)
What we need to do is use this tool well, combined with our own risk tolerance, capital management, and mindset control, to form a complete trading system.
Finally, the complete source code for this system has been open-sourced on FMZ Quant Platform. If you have any questions or improvement suggestions, feel free to discuss in the community. Let's explore the possibilities of quantitative trading together and find our own rhythm in this volatile market.
Risk Disclaimer: This article is for technical sharing only and does not constitute investment advice. Cryptocurrency trading carries significant risks. Please make cautious decisions and trade within your means.
The accompanying code for this article is open-sourced. Visit FMZ Quant Platform to get the complete workflow: https://www.fmz.com/strategy/524103
- 1