সুপার স্কালপার
লেখক:চাওঝাং, তারিখ: ২০২২-০৫-১৭ ১৪ঃ২৩ঃ২৮ট্যাগঃআরএমএএসএমএইএমএডব্লিউএমএএটিআর
এই কৌশলটি RSI এবং ATR ব্যান্ডের উপর ভিত্তি করে তৈরি করা হয়েছে যা 5 এবং 15 মিনিটের সময়সীমার মধ্যে আরও ভাল কাজ করে। রিয়েল টাইমে ব্যবহারের আগে ১ঃ২আর দিয়ে পর্যাপ্ত ব্যাক টেস্টিং করুন।
কেবলমাত্র স্ক্রিনের চিহ্নগুলিতে ট্রেডিং এন্ট্রি করুন, লাভ বুক করতে বা এসএল ট্র্যাক করতে অতিরিক্ত ক্রয় / বিক্রয় সতর্কতা ব্যবহার করুন।
আমি ৬৫ ও ২১ এর গোল্ডেন ক্রস ওভারও যোগ করেছি।
ব্যাকটেস্ট
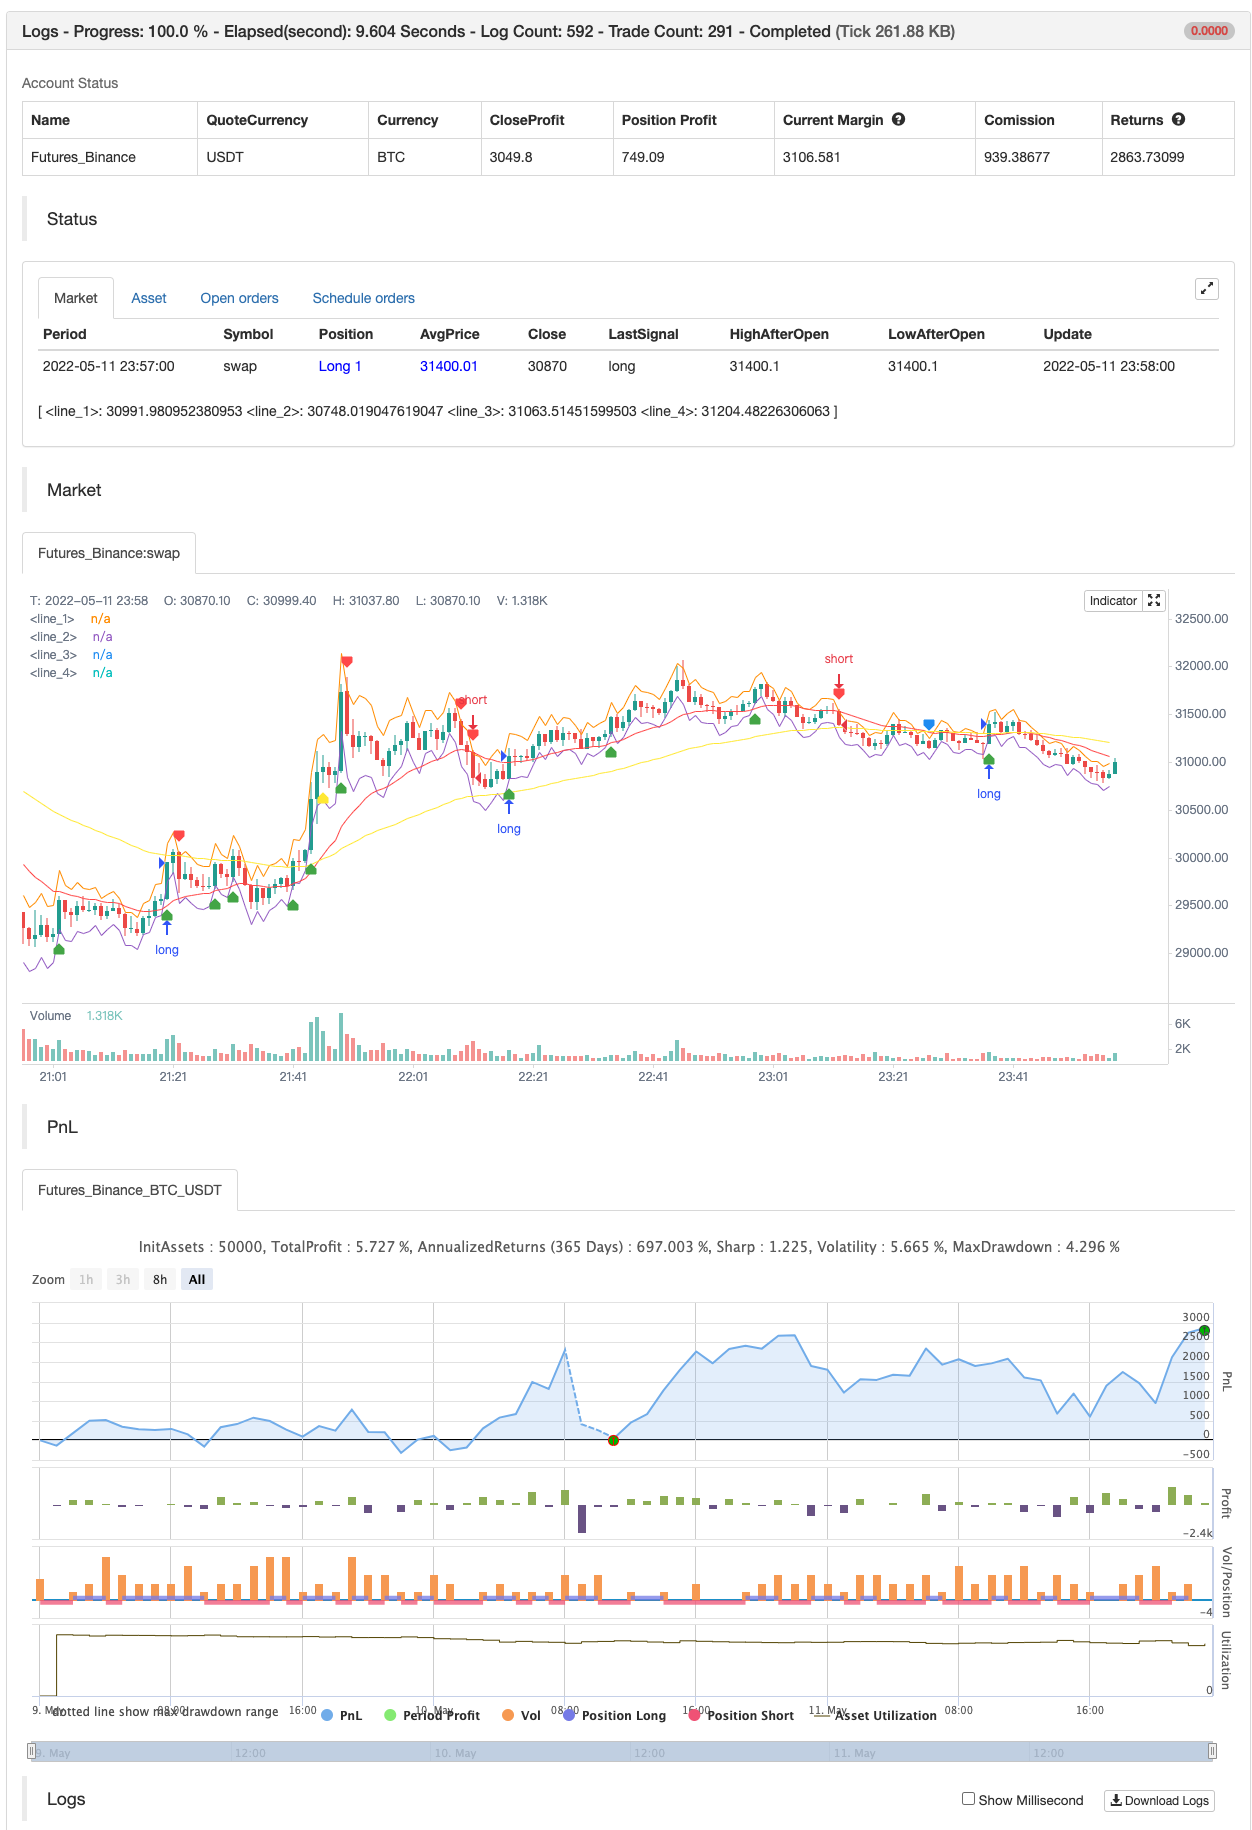
/*backtest
start: 2022-05-09 00:00:00
end: 2022-05-11 23:59:00
period: 1m
basePeriod: 1m
exchanges: [{"eid":"Futures_Binance","currency":"BTC_USDT"}]
*/

//@version=4
strategy("Super Scalper - 5 Min 15 Min", overlay=true)
source = close
atrlen = input(14, "ATR Period")
mult = input(1, "ATR Multi", step=0.1)
smoothing = input(title="ATR Smoothing", defval="WMA", options=["RMA", "SMA", "EMA", "WMA"])
ma_function(source, atrlen) =>
    if smoothing == "RMA"
        rma(source, atrlen)
    else
        if smoothing == "SMA"
            sma(source, atrlen)
        else
            if smoothing == "EMA"
                ema(source, atrlen)
            else
                wma(source, atrlen)
atr_slen = ma_function(tr(true), atrlen)
upper_band = atr_slen * mult + close
lower_band = close - atr_slen * mult

// Create Indicator's
shortSMA = ema(close, 21)
longSMA = ema(close, 65)
rsi = rsi(close, 14)
atr = atr(14)

// Specify  conditions
longCondition = open < lower_band
shortCondition = open > upper_band
GoldenLong = crossover(shortSMA,longSMA)
Goldenshort = crossover(longSMA,shortSMA)

plotshape(shortCondition, title="Sell Label", text="Sell", location=location.abovebar, style=shape.labeldown, size=size.tiny, color=color.red, textcolor=color.white, transp=0)
plotshape(longCondition, title="Buy Label", text="Buy", location=location.belowbar, style=shape.labelup, size=size.tiny, color=color.green, textcolor=color.white, transp=0)
plotshape(Goldenshort, title="Golden Sell Label", text="Golden Crossover Short", location=location.abovebar, style=shape.labeldown, size=size.tiny, color=color.blue, textcolor=color.white, transp=0)
plotshape(GoldenLong, title="Golden Buy Label", text="Golden Crossover Long", location=location.belowbar, style=shape.labelup, size=size.tiny, color=color.yellow, textcolor=color.white, transp=0)
// Execute trade if condition is True
if (longCondition)
    stopLoss = low - atr * 2
    takeProfit = high + atr * 5
    strategy.entry("long", strategy.long, when = rsi > 50)


else if (shortCondition)
    stopLoss = high + atr * 2
    takeProfit = low - atr * 5
    strategy.entry("short", strategy.short, when = rsi < 50)


// Plot ATR bands to chart

////ATR Up/Low Bands

plot(upper_band)
plot(lower_band)

// Plot Moving Averages
plot(shortSMA, color = color.red)
plot(longSMA, color = color.yellow)
সম্পর্কিত
- সুপারজাম্প টার্ন ব্যাক বোলিঞ্জার ব্যান্ড
- ইএসএসএমএ
- সুপার স্কালপার - ৫ মিনিট ১৫ মিনিট
- এসএসএল হাইব্রিড
- রেইনবো ওসিলেটর
- আরও স্মার্ট ম্যাকডি
- ক্রয়/বিক্রয় সহ EMA ADX RSI এর স্কাল্পিং
- সুপারট্রেন্ডড মুভিং মিডিয়ার
- মুনাফা সর্বাধিকীকরণকারী PMax
- গতির উপর ভিত্তি করে ZigZag
আরো
- জনির বট
- এসএসএল হাইব্রিড
- চ্যান্ডেলিয়ারের প্রস্থান
- রিসোটো
- ইএমএ ক্লাউড ইনট্রা-ডে স্ট্র্যাটেজি
- পিভট পয়েন্ট সুপারট্রেন্ড
- সুপারট্রেন্ড+৪চলমান
- গতির উপর ভিত্তি করে ZigZag
- ভিউম্যানচু সিফার বি + ডিভার্জেন্স কৌশল
- কনসেপ্ট ডুয়াল সুপারট্রেন্ড
- ব্যাকটেস্টিং- সূচক
- প্রচলিত
- এসএমএ বিটিসি খুনি
- এমএল সতর্কতা টেমপ্লেট
- বিরতি সহ ফিবোনাচি অগ্রগতি
- আরএসআই এমটিএফ ওব+ও
- ফুকুইজ ওক্টা-ইএমএ + ইচিমোকু
- সিসিআই এমটিএফ ওব+ও
- আরও স্মার্ট ম্যাকডি
- ওসিসি কৌশল R5.1