স্টোক্যাস্টিক + আরএসআই, ডাবল স্ট্র্যাটেজি
লেখক:চাওঝাং, তারিখ: ২০২২-০৫-২৫ ১৬ঃ১২ঃ১৪ট্যাগঃস্টোচআরএসআই
এই কৌশলটি ক্লাসিকাল আরএসআই কৌশলকে একত্রিত করে, যখন আরএসআই 70 এর উপরে বৃদ্ধি পায় (বা 30 এর নিচে নেমে গেলে কিনতে) এবং ক্লাসিকাল স্টোক্যাস্টিক স্লো কৌশলটি যখন স্টোক্যাস্টিক অ্যাসিললেটর 80 এর মান অতিক্রম করে তখন বিক্রি করে (এবং এই মান 20 এর নিচে হলে কিনতে) ।
এই সহজ কৌশলটি কেবল তখনই সক্রিয় হয় যখন আরএসআই এবং স্টোকাস্টিক উভয়ই একটি ওভারক্রয় বা ওভারসোল্ড অবস্থায় থাকে। এসএন্ডপি 500 এর এক ঘন্টা চার্ট সম্প্রতি এই দ্বৈত কৌশলটির সাথে বেশ ভাল কাজ করেছে।
যাইহোক, এই কৌশলটি
সমস্ত ট্রেডিংয়ে উচ্চ ঝুঁকি জড়িত; অতীতের পারফরম্যান্স ভবিষ্যতের ফলাফলের জন্য প্রয়োজনীয় নয়।
ব্যাকটেস্ট
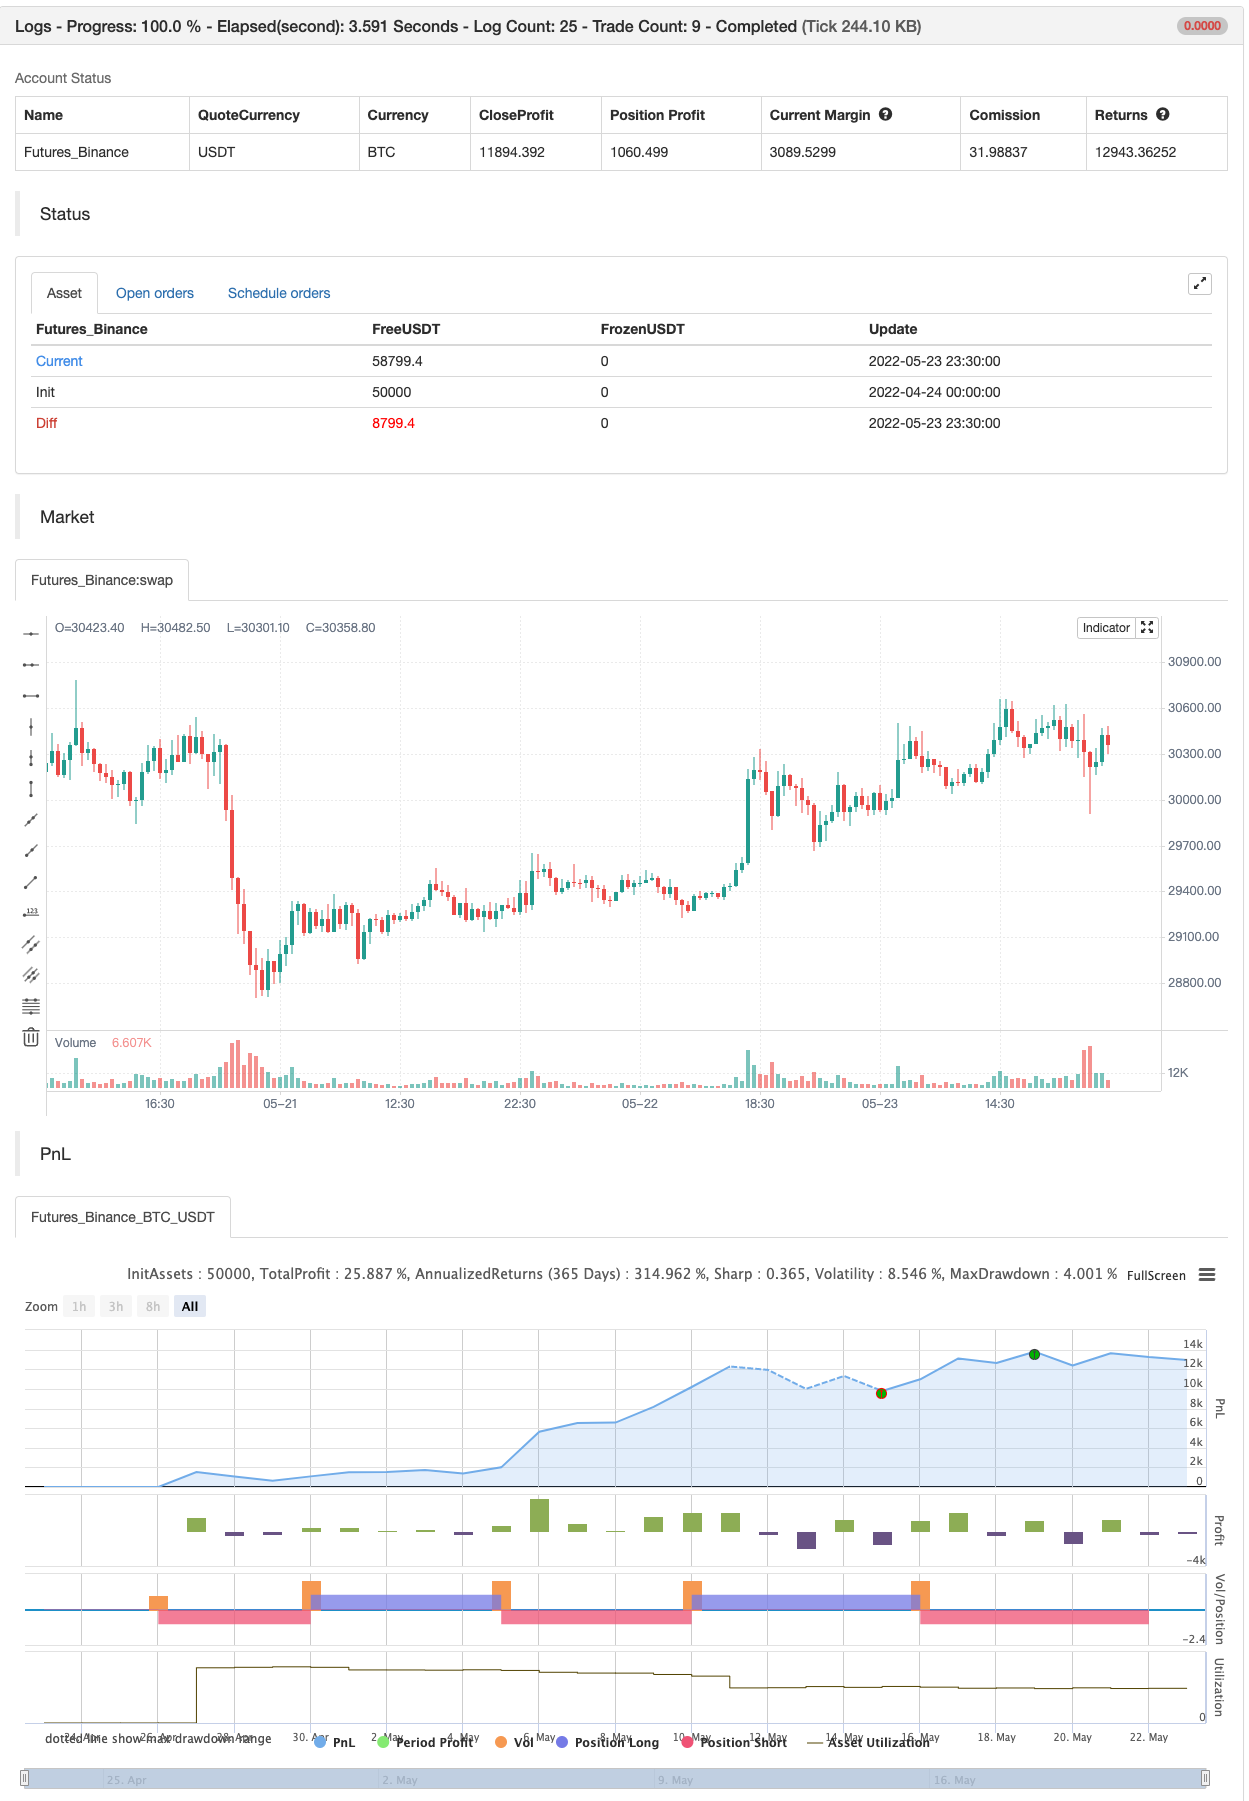
/*backtest
start: 2022-04-24 00:00:00
end: 2022-05-23 23:59:00
period: 30m
basePeriod: 15m
exchanges: [{"eid":"Futures_Binance","currency":"BTC_USDT"}]
*/

//@version=2
strategy("Stochastic + RSI, Double Strategy (by ChartArt)", shorttitle="CA_-_RSI_Stoch_Strat", overlay=true)

// ChartArt's Stochastic Slow + Relative Strength Index, Double Strategy
//
// Version 1.0
// Idea by ChartArt on October 23, 2015.
//
// This strategy combines the classic RSI
// strategy to sell when the RSI increases
// over 70 (or to buy when it falls below 30),
// with the classic Stochastic Slow strategy
// to sell when the Stochastic oscillator
// exceeds the value of 80 (and to buy when
// this value is below 20).
//
// This simple strategy only triggers when
// both the RSI and the Stochastic are together
// in overbought or oversold conditions.
//
// List of my work:
// https://www.tradingview.com/u/ChartArt/


///////////// Stochastic Slow
Stochlength = input(14, minval=1, title="lookback length of Stochastic")
StochOverBought = input(80, title="Stochastic overbought condition")
StochOverSold = input(20, title="Stochastic oversold condition")
smoothK = input(3, title="smoothing of Stochastic %K ")
smoothD = input(3, title="moving average of Stochastic %K")
k = sma(stoch(close, high, low, Stochlength), smoothK)
d = sma(k, smoothD)


///////////// RSI
RSIlength = input( 14, minval=1 , title="lookback length of RSI")
RSIOverBought = input( 70  , title="RSI overbought condition")
RSIOverSold = input( 30  , title="RSI oversold condition")
RSIprice = close
vrsi = rsi(RSIprice, RSIlength)


///////////// Double strategy: RSI strategy + Stochastic strategy

if (not na(k) and not na(d))
    if (crossover(k,d) and k < StochOverSold)
        if (not na(vrsi)) and (crossover(vrsi, RSIOverSold))
            strategy.entry("LONG", strategy.long, comment="StochLE + RsiLE")


if (crossunder(k,d) and k > StochOverBought)
    if (crossunder(vrsi, RSIOverBought))
        strategy.entry("SHORT", strategy.short, comment="StochSE + RsiSE")


//plot(strategy.equity, title="equity", color=red, linewidth=2, style=areabr)
সম্পর্কিত
- ক্রয় ও বিক্রয় কৌশল AO+Stoch+RSI+ATR এর উপর নির্ভর করে
- বোলিংজার ব্যান্ড স্টোকাস্টিক আরএসআই এক্সট্রিম সিগন্যাল কৌশল
- বিবিএসআর এক্সট্রিম স্ট্র্যাটেজি
- RSI - কিনুন বিক্রয় সংকেত
- RSI পরিসংখ্যানগত সুইচিং কৌশল
- আরএসআই এমটিএফ ওব+ও
- আরএসআই রিলেটিভ স্ট্রেনথ ইন্ডেক্স কৌশল
- সুপারট্রেক্স
- TMA-Legacy
- বোলিংজার + আরএসআই, ডাবল স্ট্র্যাটেজি v1.1
আরো
- এসএসএল চ্যানেল
- হেল স্যুট কৌশল
- প্যারাবোলিক এসএআর কিনুন এবং বিক্রয় করুন
- পিভট ভিত্তিক ট্রেইলিং সর্বোচ্চ ও সর্বনিম্ন
- নিক রাইপক ট্রেলিং রিভার্স (এনআরটিআর)
- জিগজ্যাগ পিএ কৌশল V4.1
- ইনট্রা ডে কেনা/বিক্রয়
- ব্রেকড ফ্র্যাক্টাল: কারো ভাঙা স্বপ্ন আপনার লাভ!
- মুনাফা সর্বাধিকীকরণকারী PMax
- নিখুঁত বিজয় কৌশল
- সুইং হুল/আরএসআই/ইএমএ কৌশল
- স্কেলপিং সুইং ট্রেডিং টুল R1-4
- সেরা গলফিং + ব্রেকআউট কৌশল
- বোলিংজার অ্যামেজিং অ্যালার্ট R1
- মাল্টি এক্সচেঞ্জ প্লাগইন
- ত্রিভুজ সুইচিং (ছোট মুদ্রার বিনিময় মূল্যের পার্থক্য)
- বাইবিট বিপরীত চুক্তির গতিশীল গ্রিড (বিশেষ গ্রিড)
- ট্রেডিংভিউ সতর্কতা MT4 MT5 + গতিশীল ভেরিয়েবল NON-REPAINTING
- ম্যাট্রিক্স সিরিজ
- সুপার স্কালপার - ৫ মিনিট ১৫ মিনিট