Three of the more classic strategies are Dual Thrust, R-Breaker, and Dynamic Breakout II.
Author: Zero, Created: 2015-06-11 15:10:37, Updated: 2020-04-27 09:11:26With the gradual maturity of the stock index futures market participants, the technological implementation of the relevant domestic programmatic trading platform, and the advantages of programmatic trading itself, programmatic trading has gained a leap in the domestic futures market in recent years. Programmatic trading is a commonly used trading method in the international market, and the application area of foreign programmatic trading is very wide, mainly with portfolio management, leverage trading, trend trading and other quantitative strategies.
In his 1998 book, The Bayesian Trading System, a well-designed trading system must be clearly specified for all relevant parts of the investment decision-making process, while also meeting the psychological characteristics of the user, the statistical characteristics of the investment object and the risk characteristics of the invested funds. The paradigm of the FX system is no more than the Bayesian Trading System introduced by Richard Dennis in late 1983, which shows a complete trading system including: what the market buys; how much the position buys; when the position buys; when the market buys; when the loss buys; when the loss buys and when the loss buys; when the stop buys and when the profit buys; how to buy and sell strategies. Based on the logical relationship between the strategy principle and the market data, the thinking behind the trading strategy can be divided into top-down and bottom-up; top-down approach refers to the search for patterns from the perspective of an investment concept or theoretical foundation, and the formation of a trading strategy based on this; for example, forward pricing strategies based on the theory of holding costs, according to the rules of industry rotation, configuring a stock portfolio to obtain a strategy of super-alpha, etc. Bottom-up approaches are based on market statistics, based on historical statistical features; for example, the opening price of the current period is higher than the average price of yesterday's listing, the highest price, the lowest price, and the average of the three closing prices, but more, and vice versa; or strategies based on the net change in the direction of the trading day, determined by a single institution with a fixed interest rate; trading strategies are more easily influenced by market conditions. Figure 1: Historical ranking of the TOP 10 of the country's FX system
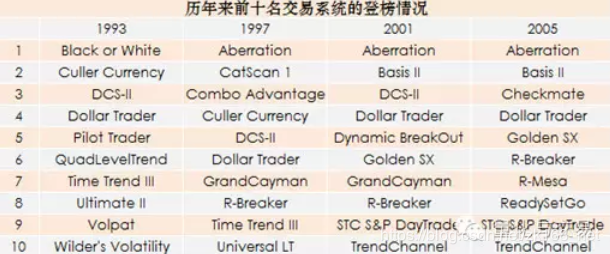
In the developed capital markets of Europe and the Americas, systematic trading is constantly evolving with changes in capital, technology, and regulation, and the strategies for systematic trading are endless. The following is a historical ranking of the best trading systems in 2005 as determined by Futures Magazine, with some trading systems showing more stable characteristics at different times. The 2008 US S&P 500 trading system TOP 10 rankings are: Turbo Trader Pro, Anticipation, Samurai 35, Dual Thrust, Maxim, Mesa T-Notes, Qtech Bellies, Keystone, Sledge Hammer, Delphi Universal. Despite the name of the trading system in foreign markets, the developers are generally reluctant to publish mature trading strategies, and investors have difficulty in understanding the principles of many trading strategies. This article attempts to understand the design principles of some mature trading strategies in foreign markets, while examining their applicability in the domestic futures market through several examples of mature trading strategies that have been made public. The first is dual-thrust. Figure 2: Principles of dual thrust and the opening range breakout strategy
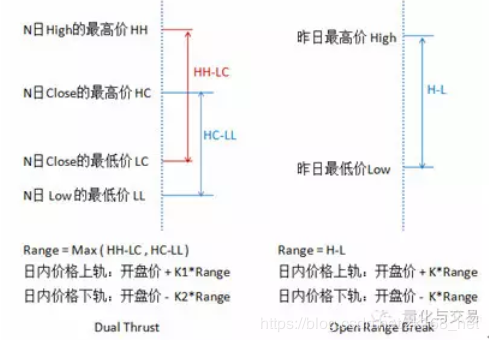
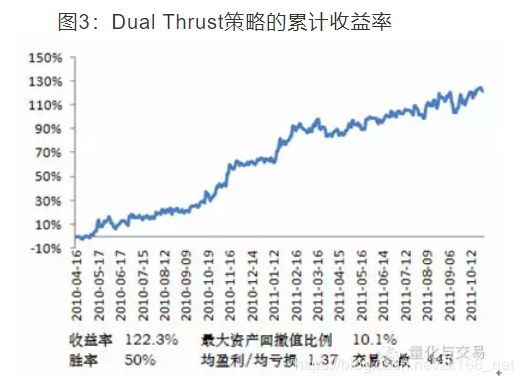
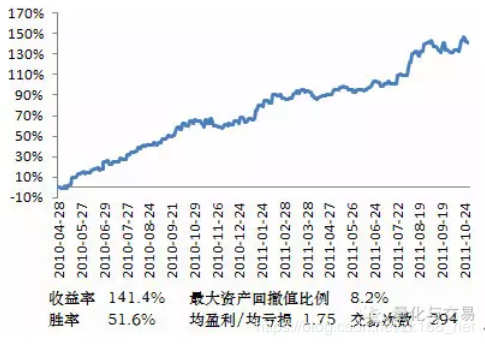
The opening range breakout is one of the more common intraday trading strategies, which determines the uptrend by adding a certain proportion of yesterday's amplitude to today's opening price and decreasing it. The intraday breakout is more flat when it is up and more flat when it is down. Dual Thrust is similar in form to the opening range breakout strategy. The main differences are reflected in two aspects: Dual Thrust on the range setting, introducing the four prices of the previous N days, making the range relatively stable over a period of time, can be used for day-to-day trend tracking; Dual Thrust multi-head and trigger conditions, considering asymmetrical width, multi-head and blank reference range can be selected different cycles, and can also be determined by parameters K1 and K2. When K1 < < K2, multi-head is relatively easy to trigger; when K1 > K2, blank head is relatively easy to trigger; when K1 > K2, blank head is relatively easy to trigger. Thus, when using this strategy, investors can either refer to the best parameters of the historical data test on the one hand, or on the other hand, they can dynamically adjust the values of K1 and K2 in stages based on their own judgments of the background, or from other large-cycle technical indicators. In order to make the strategy more realistic, some simple trading rules are added, such as initial stop loss, cross-cycle data references, etc. To be more precise, the initial capital is 1 million, each time the position is opened at 30%, the daily break-even MA5 > MA10 is more than 30 minutes, and the daily break-even MA5 is 30 minutes. Figure 3: Cumulative returns of the dual thrust strategy
2 and R-Breaker In the forex trading system, the Pivot Points trading method is a classic trading strategy. Pivot Points is a very simple resistance support system that calculates seven prices based on yesterday's high, low and close prices, including one pivot point, three resistance points and three support points. Figure 4: Principles of the Pivot Points strategy
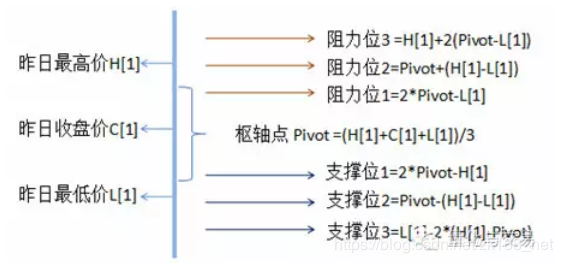
Resistance lines and support lines are one of the tools often used in technical analysis, and the role of support lines and pressure lines is that they can be transformed into each other. From a trading point of view, the Pivot Point is like a battle map, pointing out to investors the support and resistance prices that should be focused on in the disk, and as for the specific tactical support, the Pivot Point is not specifically specified, it depends entirely on the investor's own trading position strategy. Figure 5: Principles of the R-Breaker strategy
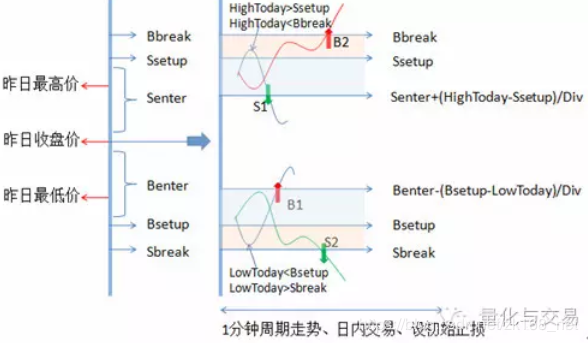
R-Breaker calculates six prices as the reference price for trading in today's disk based on yesterday's price, but only one pivot point less than the Pivot Points setting. The difference between R-Breaker and Pivot Points is that the distance between the six prices is more flexible through the parameter setting, and R-Breaker clarifies the specific trading strategy. Based on the price movement in the disk, trend tracking and reversal strategies are used simultaneously. Since the trigger conditions for opening a position in the range involve multiple prices and are more sensitive to intraday price movements, the strategy is suitable for trading on one-minute cycles. In addition, the strategy does not trigger a large number of trades, regardless of cross-cycle conditions. The 1 minute data source for TB IF888 is as early as 2010/4/28, and other test conditions are the same as for Dual Thrust. Figure 6: Cumulative returns from the R-Breaker strategy
In order to verify the effectiveness of its strategy, R-Breaker's ideas were transferred to the Pivot Point fixed by the distance parameter, where the test results showed a return of 103.6%, a maximum asset revaluation ratio of 14.6%, a win rate of 40.96%, an average profit/loss of 1.97 and a total number of trades of 595. 3 Dynamic Breakout II Figure 7: S&P 500 and implied volatility VIX
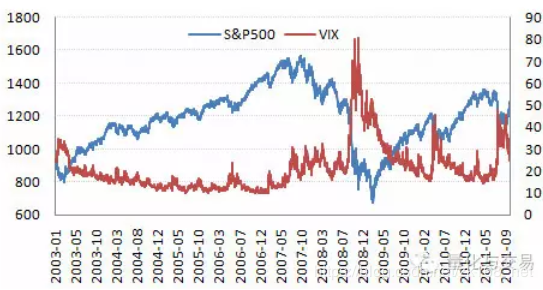
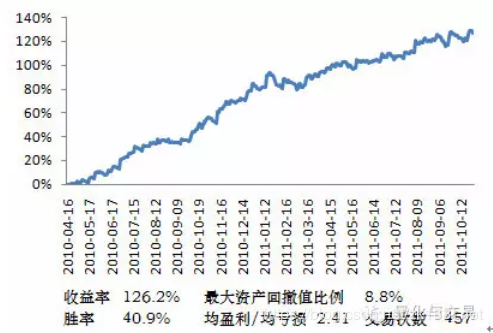
The principle of dynamic breakouts is related to volatility, and we first review the relationship between volatility and the index. The implicit volatility of the index, which is usually measured based on the standard deviation of the price calculated from historical data, is usually not possible to calculate because of the lack of index-based options derivatives. Here, reference can be made to the VIX index, also known as the panic index, which represents the market's expectation of market volatility for the next 30 days. The idea of a dynamic breakout is to capture trends by plotting market volatility, combined with the use of a Brin line and the practice of breaking past highs or lows. When market volatility is low, the probability of continuing the current trend is greater, and when the width of the Brin line is calculated, the number of regression cycles used is reduced, making it easier to trigger open positions; when the market volatility increases, the trend is likely to reverse, while increasing the number of regression cycles used to filter false signals, while calculating the width of the Brin line makes it relatively difficult to open positions. The Dynamic Breakout II strategy involves doing more when the price breaks past the previous high and overtakes the Brin, doing more when the price breaks past the previous low and breaks down the Brin, and using the Brin median line as a tracking stop in addition to the initial stop loss. Other test conditions are the same as for Dual Thrust. Figure 8: Cumulative returns from the Dynamic Breakout II strategy
Dual Thrust, R-Breaker, and Dynamic Breakout II have different cycles of application and different strategies. The combined yield curve becomes smoother with a maximum asset withdrawal ratio of 5.2%, indicating the advantages of a diversified portfolio strategy. It is worth noting that the above yield curve is based on historical data and is tested using relative optimization parameters. In the process of real-time trading, historical optimization parameters are not adapted to the previous market characteristics, and investors must be aware of the principles of the trading strategy in the process of using the programming, so as to understand the relationship between the market characteristics and the trading results. 1st, the choice of the programmatic trading platform Currently, the domestic programmatic trading platforms are Pyramid, Trade Pioneer, Shenhua, QuickTime, Penguin, etc. These trading platforms are trading software based on the background of the CTP. In the platform selection, it is necessary to combine the stability of the software, the usability of the trading strategy, the cost of use, the habits of use, etc. to choose the platform that is suitable for your own trading. For example: Pyramid supports charting programming, background programming, support for VBS development and external databases, scalability; the trading strategy test report of the trading pioneer is more detailed, and the foreign TradeStation code is easy to port to the TB platform. 2 Details of real-time trading The real-time data of the programmatic trading platform is derived from the central bank, the central bank 500ms pushes the Tick data once, different platforms extract data for longer cycles themselves, different extraction rules can lead to inconsistent data. For example, the pyramid and TB are different in the method of splitting the K-line in the daytime cycle, as well as the time marking of the K-line. Trading strategy testing involves calculating the corresponding parameters once per cycle in a set period, while real-time data is pushed in real-time in real-time trading, which may cause problems with repeating trading signals. Some platform software supports a round-question mode with a fixed number of seconds between each interval, and a K-line mode to read the data, and the frequency of data refresh is chosen depending on the strategy itself. In addition to the problem of signal repetition, there may also be cases where orders are not traded, repeated positions are opened, stop-loss is not triggered, which requires investors to consider possible adverse events in advance, and adjust the strategy accordingly, such as converting the code to run on a smaller cycle, considering the number of indicators, controlling the number of secondary positions through full variables. 3. Trading mentality in the process of executing a transaction Successful investments require not only the right market analysis, but also a thorough risk management and good mental control, the so-called 3M (Mind, Money, Market). Some investors question the trading system used, the trading mentality is difficult to reconcile, and even eventually abandon the use of the trading system. Each trading system has a certain adaptability to the investor's psychology, trading varieties and risk preferences of funds. Therefore, investors need to deepen their understanding of the market, understand trading strategies, and grasp the principles, including the trading mentality and trading methods, in order to truly play the role of programmed trading.
- FMZ research platform Python introductory guide
- Some Bitcoin and digital currency quantification strategies worth learning
- Make Post-Only order and bulk orders on BitMEX through IO
- On how to list and order in bulk on BitMEX only passively (IO example)
- Inventor of the digital currency quantification platform websocket user guide (Details after the Dial function upgrade)
- Best ways to install and upgrade Linux hosts
- FMZ Quantify Platform features you know?
- Details of the BitMEX listing policy
- The CoinPark General Protocol Python 2 version
- BitMEX exchange API note
- X Minutes to Python
- Pyramid schemes are better
- Why is the onexit function not executed?
- 亚当理论里的一个小故事.
- One of the newcomers to the K-line collection on the hard disk
- Some tips for re-testing the wrong packaging
- TypeError: Cannot access member 'GetRecords' of undefined at
:1:-1 Where is the problem? - On the strategy of single platform balancing
- Why choose to trade strategically on the FMZ Quantitative Trading Platform (BotVS)
- The strategy of making money could also be a coin.
- Inventors quantify the path of automated trading
- Bowen looks back on two years of the beach
- The Law of Grid Trading
- I've created a forum, use it for a while.
- Join the Makers in high-frequency trading strategy
- Reserve orders and iceberg orders for high-frequency trading strategies
- Poke for bargain high-frequency trading strategy
- Improvements and advantages of multi-platform hedge stability swap V2.7
- About being sucked in
- Single-point sniper with high-frequency stacking automatic counter-hand unlocking algorithm
- Penny Jump for high-frequency trading strategy
bamsmenHow do you calculate pivot_high and pivot_low?
lazypWhy didn't the landlord write these three strategies on the platform?
dyhhuI'm so happy for you.
enzoThank you for sharing!
The Little DreamDT some, others I take time to write.