A synergistic understanding of intuition
Author: Ilidhan, Created: 2016-12-29 13:38:09, Updated:A synergistic understanding of intuition
Introduction: This article aims to provide an intuitive introduction to the concept of synergy, to help you understand its basic meaning, the motivations behind the concept, and simple application scenarios.
-
Co-created profiles
Here I just want to point out that the intuitive definition of coherence does not involve a strict definition of mathematical symbols and strict formulae inference.
If you are interested, you can refer to Wikipedia Cointegration. Quantitative classes will also be discussed in depth in the future.
Why should we be balanced/co-ordinated?
In the words of the author, "the most important thing is to be a good citizen of the world".
Simply put, stationarity is a property of a sequence that remains stable over time, and it is a property that we like very much when analyzing data to make predictions. If a set of time series data is stable, it means that its mean and variance remain constant, so we can conveniently use some statistical techniques on the sequence.
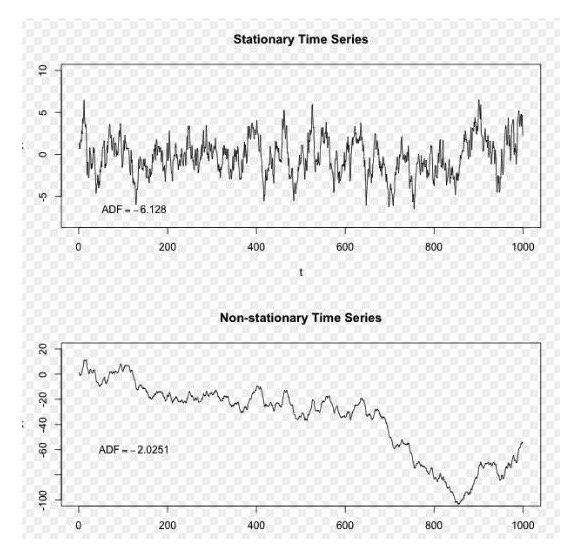
Image provided by Wikipedia
In the above diagram, the ascending sequence is a steady sequence, we can see that it is always fluctuating around a long term mean, and the descending sequence is an unsteady sequence, we can see that its long term mean is changing.
To give an example of an application, if the price sequence of an asset (or the price difference between the two sequences) is flat, then when it deviates from its mean, one can expect the price to return to this mean at some time in the future. We can use this property to make a profit by investing. Suppose a stock has a long-term mean of $9, and its present value is $8.
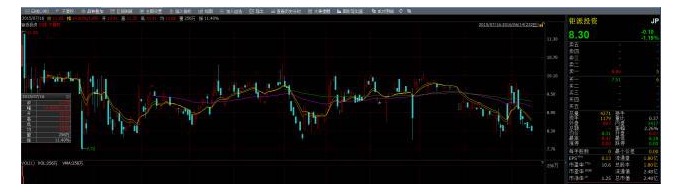
This is a sequence of stock prices that is stable in nature:
If two sets of sequences are not evenly spaced, but their linear combinations can be given a regular sequence, then we say that the two sets of time series data have a coordinate nature, and we can also apply the statistical properties to the sequence of this set; but one point to note is that the cointegration is not a correlation.
For example, if the difference between two sets of time series data is flat, then we can make a profit on the basis of the flatness of the difference: when the price difference between the two stocks is too large, according to the flatness we expect the price difference to converge, so we buy the low-priced stock, sell the high-priced stock, and wait for the price to return.
This is where pairs trading comes from.
-
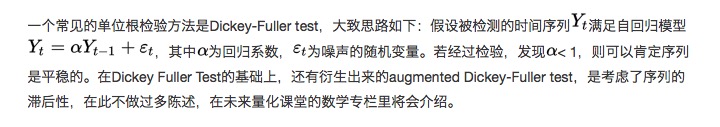
Steadiness and test methods
Strictly speaking, steadiness can be divided into strictly stationary and weakly steady. Strictly steady refers to a sequence that always has a constant distribution function, while weakly steady refers to a descriptive statistic of a constant in the sequence. All strongly steady sequences satisfy the weak steady property, but the converse is not true.
Give an example of an application
The first thing to note is that correlations are not correlations. We artificially construct two sets of data to look at correlations intuitively. import numpy as np import pandas as pd import seaborn Imported statsmodels import matplotlib.pyplot as plt from statsmodels.tsa.stattools import coint
Building data
First, we construct two sets of data, each set of data 100 in length. The first set of data is 100 plus a downtrend term plus a standard normal distribution. The second set of data is based on the first set of data plus 30, plus an additional standard normal distribution.

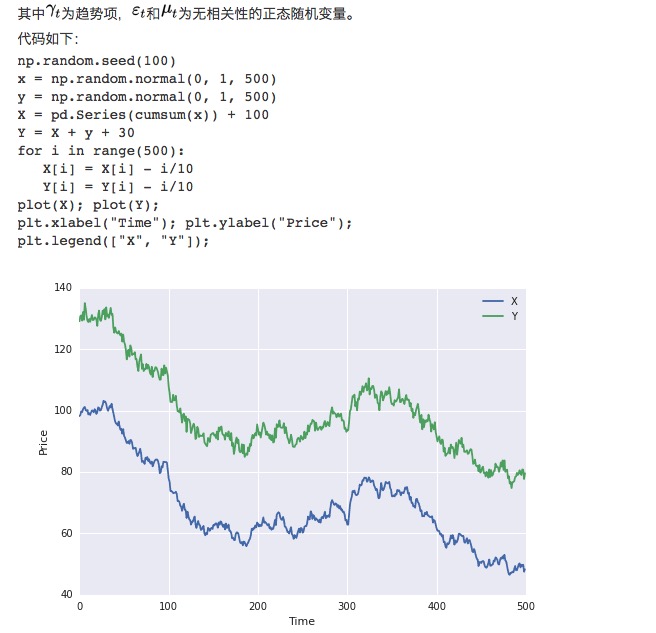
Obviously, these two sets of data are not even, because the mean changes over time. But these two sets of data are correlated because their error sequences are even:
plot(Y-X); plt.axhline((Y-X).mean(),color=“red”, linestyle="–"); plt.xlabel(“Time”); plt.ylabel(“Price”); plt.legend([“Y-X”, “Mean”]);
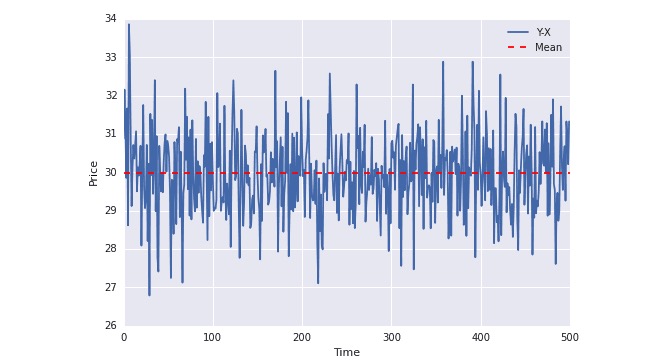
In the diagram above, you can see that the blue line has been fluctuating around the mean value. While the mean value does not change over time (in fact, the sides do not change over time).
-
The knot
If it is entirely mathematical, it will be more complicated, and later quantitative classes will be involved. We just made a simple introduction at the level of understanding (level-0) in order to make it better to combine integration with practical applications.
I'm going to share it with you, and I'm going to move from a classroom of quantification to a classroom of managing love questions.
- Template 3.2: Digital currency trading class library (integrated Cash, futures support OKCoin futures/BitVC)
- I'm sorry, but Gauss did a small job.
- A Brief History of Risk (IV) Von Mover and the Curve of the Gods
- A short history of risk (5) Bayes, a man who lives only in his textbooks
- A brilliant explanation for the alternative to stop loss
- 2.13 Common error messages, exchange API error codes, various problems encountered by digital currency robots!
- OkCoin China API error code requested
- The real volatility applied to the market basis of thinking about shushupengli trading ideas with pen
- 2.12 _D (()) Function and Timestamp
- python: Please be careful in these places.
- The hidden Markov model
- Interested in understanding the simplicity of Bayes
- 2.11 API: Simple example of use of Chart function (graph function)
- Details of the currency pair
- Beware of the Linear Mind Trap
- I've heard that reading like this can make a lot of money.
- The story of the escape and the survival of the gambler and the gambler
- 30 lines of code that takes you into the world of quantitative investing (python version)
- Gambling is a form of high-tech business
- The quantity-price relationship is an important indicator!