How to analyze the volatility of options?
Author: The Little Dream, Created: 2017-03-27 10:49:02, Updated:How to analyze the volatility of options?
Definition and classification of volatility Volatility is usually defined as the standard deviation of the price continuous plus profit yield, a percentage measure of price volatility that reflects only the magnitude of price volatility, without considering the direction of price movements, i.e. the intensity of price movements. When other factors do not change, the higher the volatility, the higher the price of the option, which is related to the correction of the option price.
-
In general, volatility rates can be divided into the following four categories:
-
1
Historical volatility is the annual standard deviation of daily returns over a specific time period. The calculation of historical volatility determines the time period and the way the price is valued, which can be the most recent 30 days, 90 days or any appropriate number of days. The price is usually based on the daily closing price. The calculation step is to first calculate the daily logarithmic rate of return, then take the standard deviation of the logarithmic rate of return for this period, and finally make an annual adjustment.
-
2
Future price volatility refers to the standard deviation of the annualized daily return at some time in the future, generally from now to the expiration date of an option. When using the B-S option pricing model to calculate the theoretical price of an option, the original definition required is future price volatility. Unfortunately, the volatility of a futures is only known when it becomes the historical volatility.
-
3
Expected price volatility is a prediction of future price volatility made by an option trader based on market conditions and historical data. It is an estimate of the future volatility rate that the trader uses to evaluate the theoretical price of an option in an option pricing formula.
-
4
Implicit volatility refers to the implied volatility of the actual option price. It is the volatility that is inverse when the actual price of the option and other parameters other than the volatility σ are incorporated into the formula using the B-S option pricing formula. The actual price of the option is formed by the competition of many option traders, so the implied volatility represents the perception and expectations of market participants about the future of the market, and is thus considered the closest to the actual volatility at that time.
Of the above four types of volatility, the historical volatility is the most readily available and the implied volatility is the closest to the real volatility, and is therefore the most practically applicable. However, implied volatility is reversed using the actual option price, and the actual option price at the time of calculation using the implied volatility becomes an unrealistic calculation. The most commonly used option theory price is still historical volatility.
-
-
The slope of the fluctuation rate: smiles versus slopes
-
1, the slope of the fluctuation
The volatility slope describes the same item in the index, the same expiration date, but different options at different execution prices are traded at different implied volatility rates. Each option with the same month of execution corresponds to an implied volatility rate, and if we take the diagonal as the execution price and the vertical as the implied volatility rate, we find that the implied volatility function on the execution price is not a horizontal line, but a curve.
-
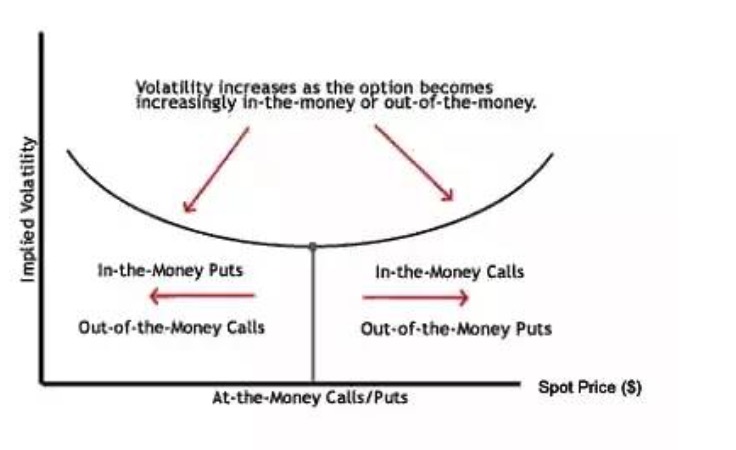
2 The frequency of the smile
The volatility smile indicates that the volatility rate changes with the execution of price changes while the expiration date remains unchanged. The further explanation is that the volatility rate of the out of money and real value options in the money is higher than the volatility rate of the parity options at the money, forming an upper crescent with a mid-low high on both sides, shaped like a crescent smile.
-
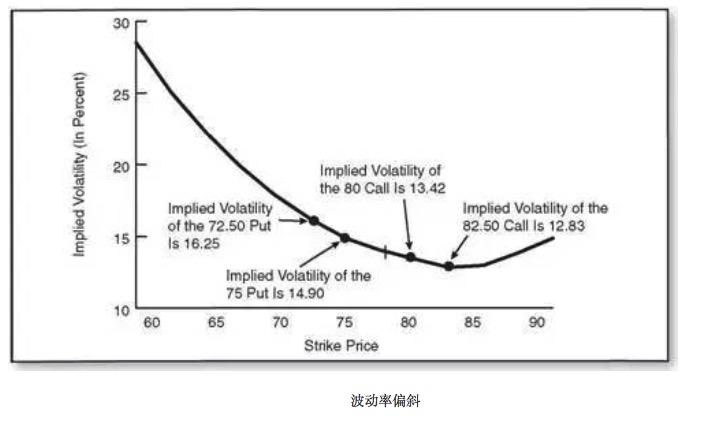
3, the slope of the wave.
In most cases, the volatility is not always smiling, which we call the volatility bias. The volatility bias is also divided into two types, one is the broad-based volatility bias, which refers to the various shapes of the volatility curve. The other is the narrow-based volatility bias, which refers to the fact that low execution prices are higher than high execution prices.
There are three main explanations for the phenomenon of volatility bias:
The probability of an index short-term bullish is less than that of a slump, and market traders demand more protection for the bottom than greed for speculation on the top.
In options trading strategies, there is a preference to sell a higher execution price of a bear option while buying a lower execution price of a bear option as an insurance against the risk of a fall in the stock price. Such a supply and demand relationship also determines that a low execution price option has a high implied volatility rate, while a high execution price option has a low implied volatility rate.
The implied volatility can be seen as the uncertainty of the future returns of the market. When the stock market falls, there will be more panic and uncertainty. For example, the number of changes in the same absolute value will fall more and more when it falls, and its increase will become less and less when it rises, thus causing more panic when it falls.
-
Four, why is there a slope?
One possible explanation is that, because the price of an option is determined by the supply-supply relationship, there is a different supply force for different options. Because the option can be compared to insurance and the execution price can be compared to a discount, this gives different protection for different execution price options, which can have different supply and demand factors. This may be the case just as there is more demand for cheap insurance, and there is more demand for absolutely lower-priced insurance.
In order to meet the larger demand, according to this reasoning, sellers of low-cost insurance require higher risk collateral; this means higher implied volatility, not higher determining price.
-
5 How volatility slope affects trading decisions
Traders must take into account the existence of volatility slope when making forecasts. For example, assuming the relative strike price of option A, the null option bridge price O trades at a higher implied volatility rate. As the price of the futures moves from the strike price A to the strike price O, there is likely to be a tendency for the implied volatility of the put option and the put option to decrease using the strike price O, while the implied volatility of the put option and the put option to increase using the strike price A.
The existence of a volatility slope is often a disadvantage to the buyer of a nil option if all other factors remain unchanged. Of course, other factors may remain unchanged, and the chance of this happening is negligible. The overall level of implied volatility may change UI, and the slope of implied volatility may also change.
-
Translated from Options House
- We hope to support the Bitmex platform
- Support for Coinbase and itbit
- MacD, please look at this.
- Indicator of the performance of trading algorithms -- Sharpe ratio
- A new kind of grid trading law
- I feel like you guys cut the cabbage, and I'm still holding the coin.
- Systematically learn regular expressions (a): basic essay
- Python and the Simple Bayes Application
- Analysis of the application of screw steel, iron ore ratio trading strategies
- Commodity futures retrospective data
- Programmatic application of options
- Time and Cycle
- Support vector machines in the brain
- Talk about being a marketer and a mother.
- The deepest road in the world is your path: dig deep into the pits of the Sutlej River
- Read the probability statistics over the threshold and the simplest probability theories you never thought of.
- This is the third installment of the Money Management Trilogy: Format First.
- I can make money by adding, I never use multiplication.
- Easton deals with fraud
- Commonly used terms for machine learning and data mining