Upgrade! digital currency futures class Martin strategy
Author: The Little Dream, Created: 2022-02-07 09:12:36, Updated: 2023-09-20 10:11:23
Upgrade! digital currency futures class Martin strategy
作为一个教学策略,兼顾一定的实战性能当然是最好的。「数字货币期货类马丁策略」在FMZ.COM围观板块也已经展示了小半年了。经历了好几拨风吹雨打,马丁、网格策略有其风险硬伤,参数保守一点也不是不能用。
-
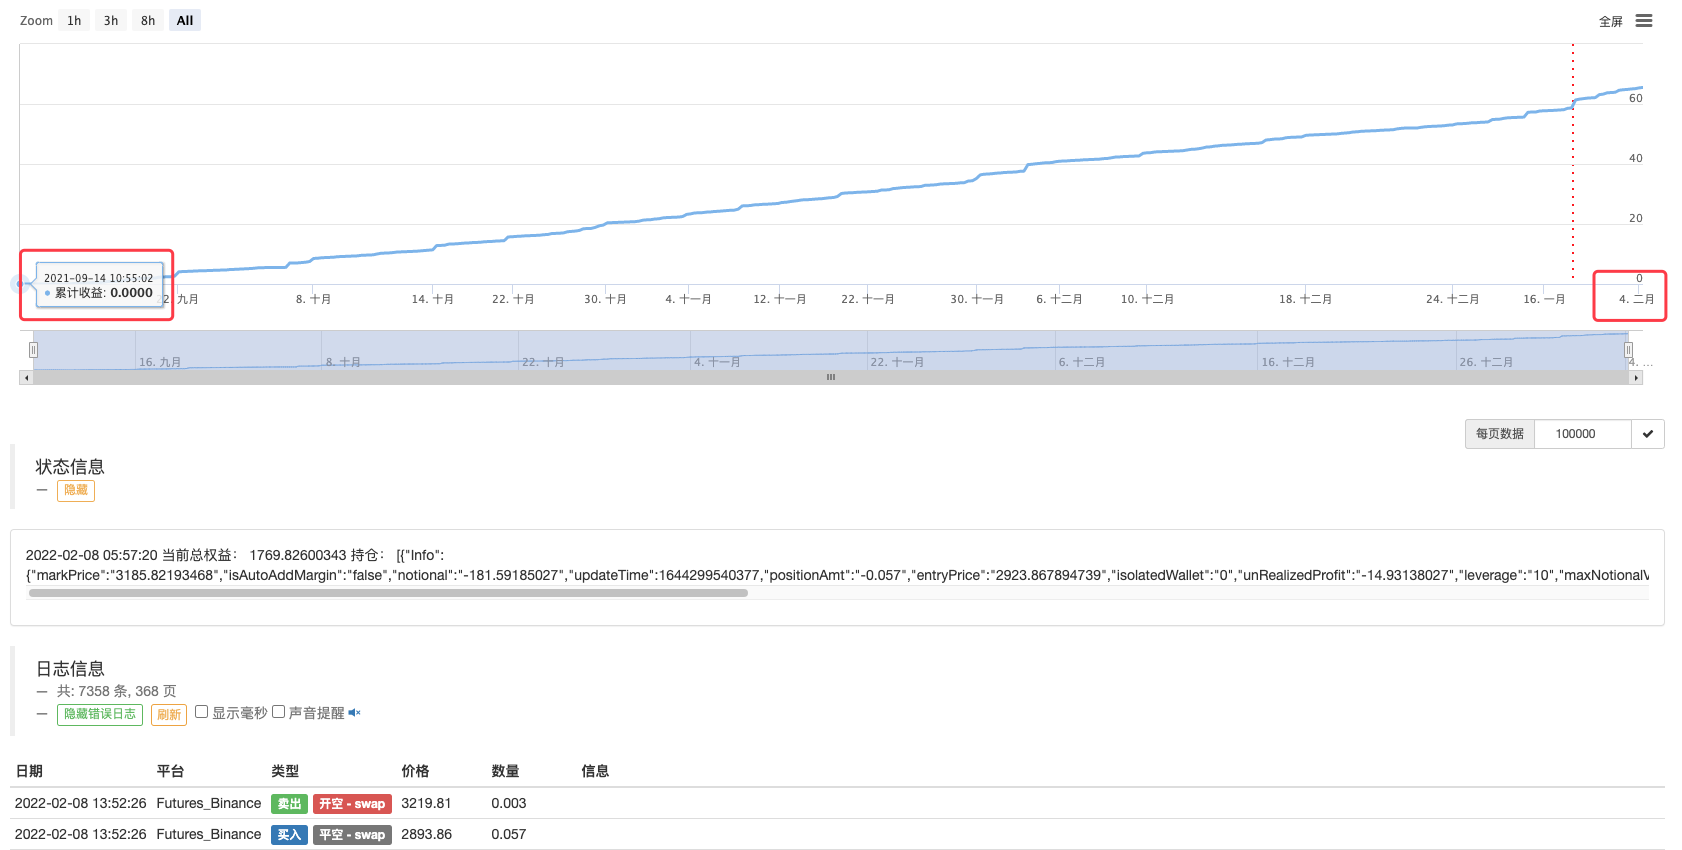
Binance futures on the spot
-
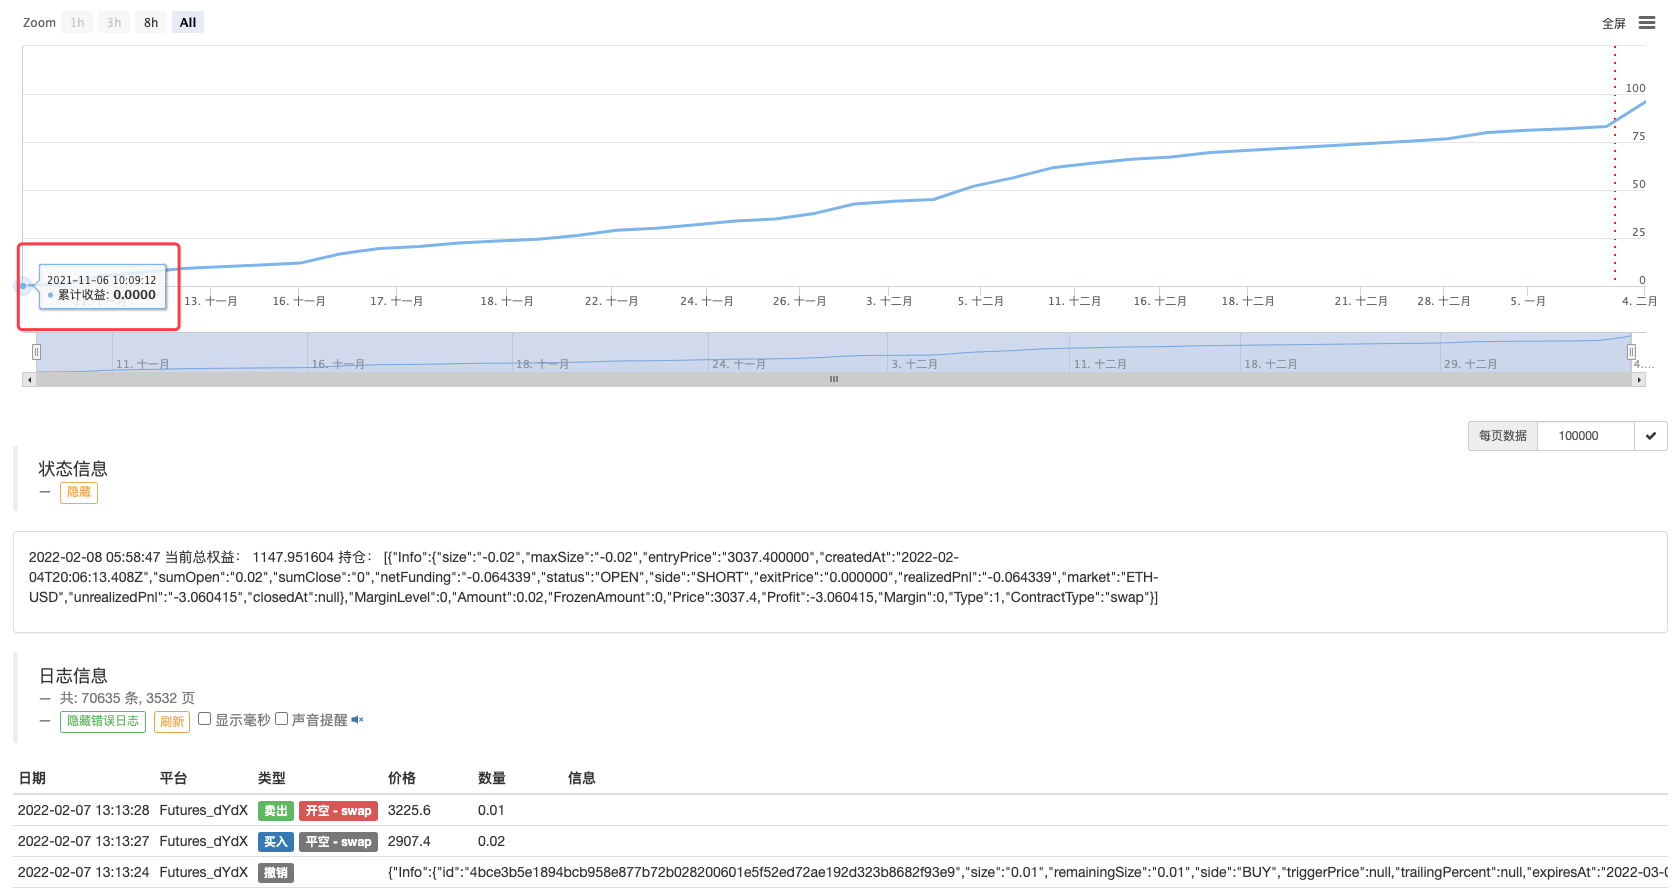
dYdX physical drive
The dream is to guarantee that there is absolutely no rechargeable aluminum production aluminum yield curve ((handy dog head)).
However, the first edition of the strategy design is relatively simple, the interface has only one holding, total rights and benefits data output, the earnings curve is only printed to achieve profit and loss, not counting the inflow and loss.
This post is about upgrading this six-month strategy of stability and stability.
The upgrade plan
- Upgraded status bar displays information about current holdings, rather than a printed set of data. Displays current total equity gains, floating gains, actual gains and losses (total gains and losses already accounted for by floating gains and losses)
- The chart below shows the current location of the listing.
The policy version before the upgrade is recorded on the policy's "Notes" page.
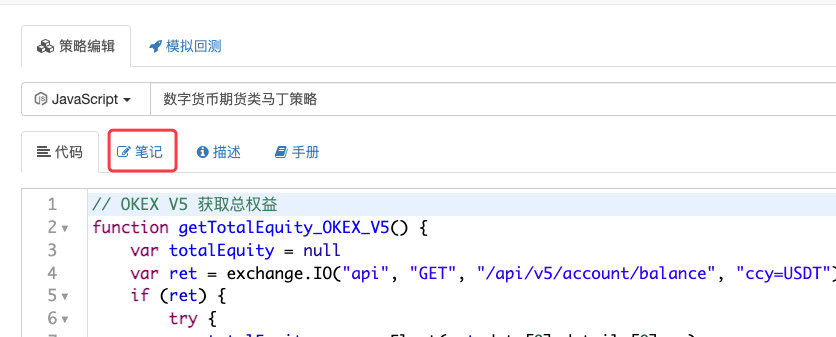
这个也是我的个人开发习惯,在FMZ.COM上很方便记录策略开发、迭代的点点滴滴。
Start the upgrade!
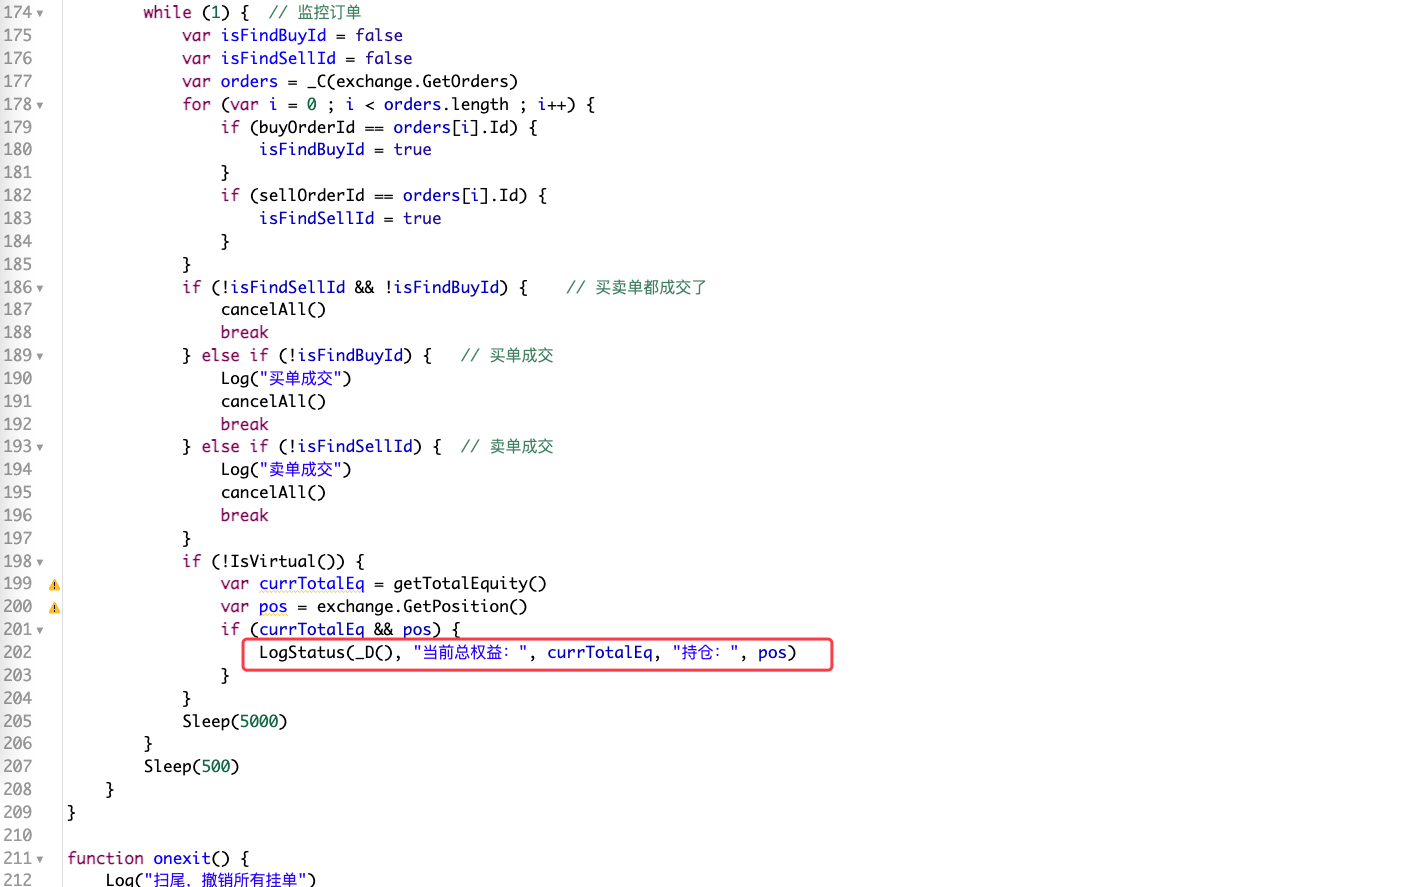
The first thing we do is optimize the status bar to show that students who are familiar with FMZ development documentation know that displaying the status bar data on FMZ is useful.LogStatusThe function. Then we find this cut-off point to start designing the code.
The next thing you want to do is add a big code:
                    var tblPos = {
                        "type" : "table",
                        "title" : "持仓",
                        "cols" : ["持仓数量", "持仓方向", "持仓均价", "持仓盈亏", "合约代码", "自定义字段 / " + SpecifyPosField],
                        "rows" : []
                    }
                    var descType = ["多头仓位", "空头仓位"]
                    for (var posIndex = 0 ; posIndex < pos.length ; posIndex++) {
                        tblPos.rows.push([pos[posIndex].Amount, descType[pos[posIndex].Type], pos[posIndex].Price, pos[posIndex].Profit, pos[posIndex].ContractType, SpecifyPosField == "" ? "--" : pos[posIndex].Info[SpecifyPosField]])
                    }

                    var tbl = {
                        "type" : "table",
                        "title" : "数据",
                        "cols" : ["当前总权益", "实际盈亏", "当前价格", "买单价格/数量", "卖单价格/数量"],
                        "rows" : []
                    }
                    var buyOrder = null
                    var sellOrder = null
                    for (var orderIndex = 0 ; orderIndex < orders.length ; orderIndex++) {
                        if (orders[orderIndex].Type == ORDER_TYPE_BUY) {
                            buyOrder = orders[orderIndex]
                        } else {
                            sellOrder = orders[orderIndex]
                        }
                    }
                    var realProfit = currTotalEq - totalEq
                    if (exchange.GetName() == "Futures_Binance") {
                        _.each(pos, function(p) {
                            realProfit += parseFloat(p.Info.unRealizedProfit)
                        })
                    }
                    var t = exchange.GetTicker()
                    tbl.rows.push([currTotalEq, realProfit, t ? t.Last : "--", (buyOrder.Price + "/" + buyOrder.Amount), (sellOrder.Price + "/" + sellOrder.Amount)])

                    // 更新图表数据
                    if (t && showLine) {
                        _.each(pos, function(p) {
                            $.PlotLine(descType[p.Type] + "持仓价格", p.Price)
                        })
                        $.PlotLine("买单挂单价格", buyOrder.Price)
                        $.PlotLine("卖单挂单价格", sellOrder.Price)
                        $.PlotLine("当前价格", t.Last)
                    }

                    // 更新状态栏数据
                    LogStatus("时间:" + _D() + "\n" + "`" + JSON.stringify(tblPos) + "`" + "\n" + "`" + JSON.stringify(tbl) + "`")
It replaces the previously simplisticLogStatusExports
LogStatus(_D(), "当前总权益:", currTotalEq, "持仓:", pos)
The strategy adds two parameters:
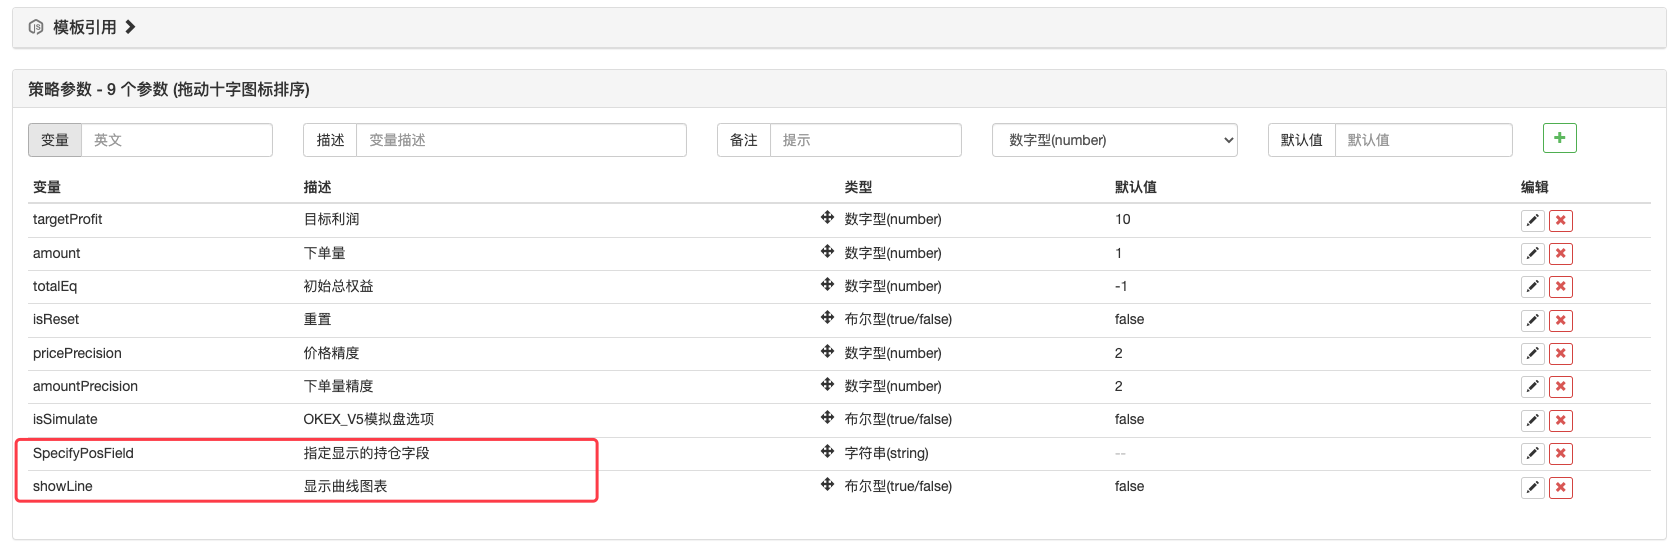
-
showLine parameters If selected, you can use the drawing line library to draw a graph on the real disk page, drawing the holding price, the hanging price, the current price curve.
-
Specify PosField To set the raw field of the holding information that needs to be displayed, since the name of the raw data field of the holding is different for each exchange. So here a custom parameter is designed to specify the field name to be displayed. For example, my Bitcoin hard drive:
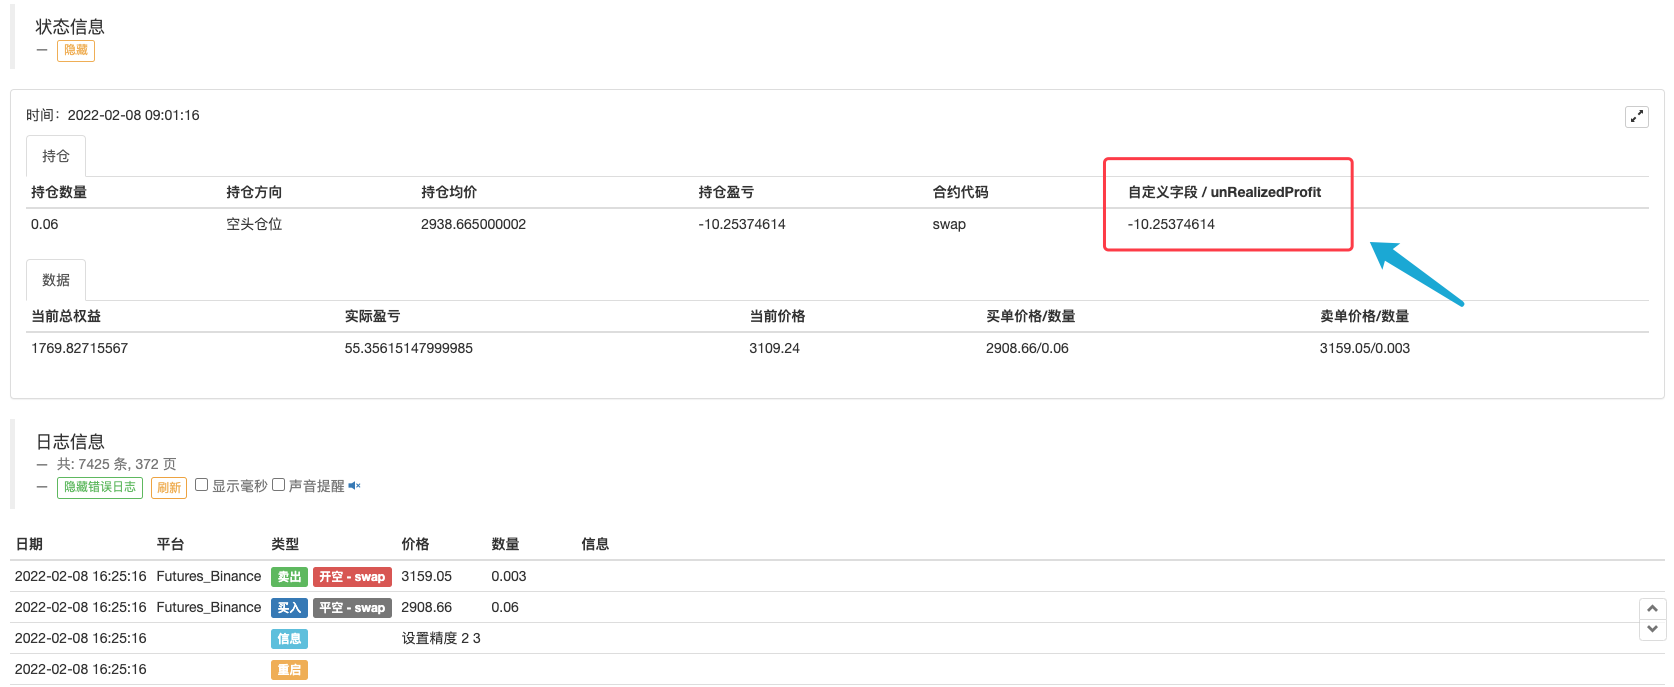
I want to display the information data in the Info field (exchange interface raw data)
unRealizedProfitThe property, that is, the holding did not achieve a profit or loss. The parameter SpecifyPosField can be set to unRealizedProfit.A similar design allows policies to adapt the output to non-uniform data, giving users the option to customize the output content themselves.
Restart the Binance, dYdX hard drive after the upgrade policy
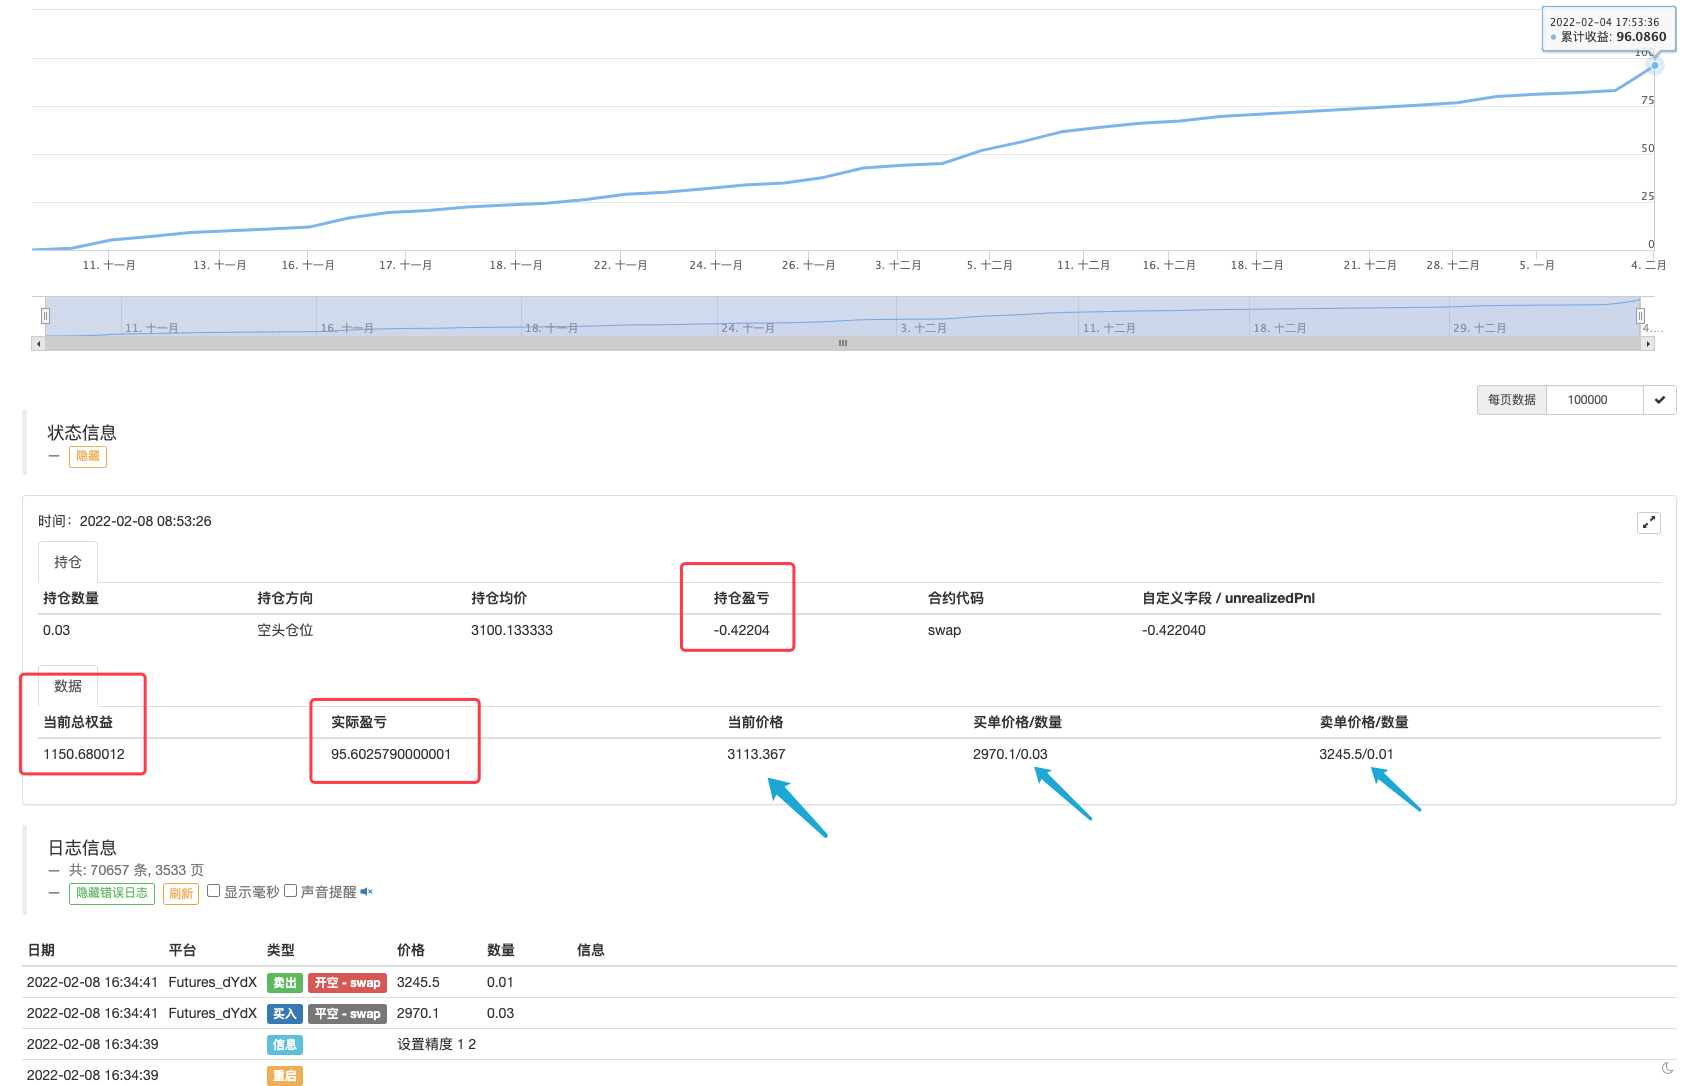
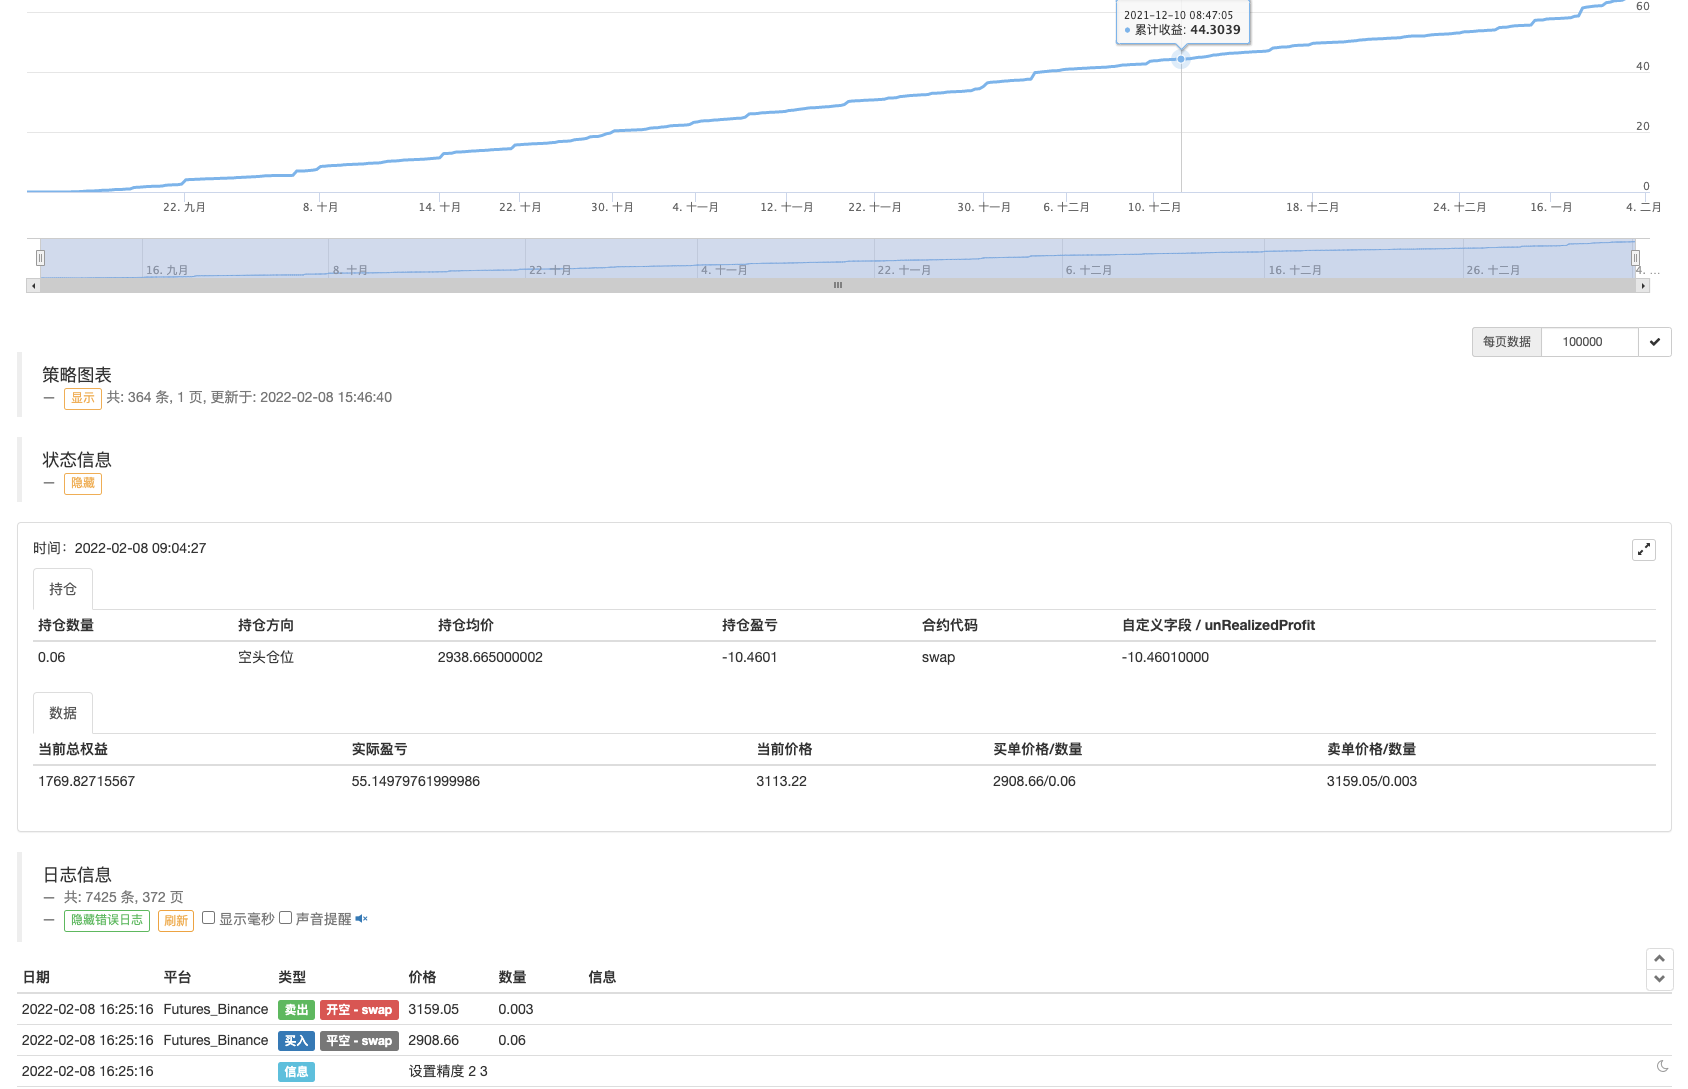
You can see the data you need to display at a glance. It is very convenient to observe the trading progress of the strategy, the current holding price, the profit and loss, the hanging order price. The strategy has a certain risk, the real disk sets control parameters according to its own risk, self-assured profit and loss. The strategy is open only for exchange and learning.
- Quantifying Fundamental Analysis in the Cryptocurrency Market: Let Data Speak for Itself!
- Quantified research on the basics of coin circles - stop believing in all kinds of crazy professors, data is objective!
- The inventor of the Quantitative Data Exploration Module, an essential tool in the field of quantitative trading.
- Mastering Everything - Introduction to FMZ New Version of Trading Terminal (with TRB Arbitrage Source Code)
- Get all the details about the new FMZ trading terminal (with the TRB suite source code)
- FMZ Quant: An Analysis of Common Requirements Design Examples in the Cryptocurrency Market (II)
- How to Exploit Brainless Selling Bots with a High-Frequency Strategy in 80 Lines of Code
- FMZ quantification: common demands on the cryptocurrency market design example analysis (II)
- How to exploit brainless robots for sale with high-frequency strategies of 80 lines of code
- FMZ Quant: An Analysis of Common Requirements Design Examples in the Cryptocurrency Market (I)
- FMZ quantification: common demands of the cryptocurrency market design instance analysis (1)
- Design of an order synchronization system based on FMZ quantification (1)
- Multiple ATR strategies for digital currency futures (teachings)
AAA386In general, n=1 in the source code doesn't seem to make sense?
HermitI think it's good to do gold XAUUSD relatively bullish down there's no ring that strong
Oh, my God.Multi-variety, dream total, first of all the profit variable, the parameter needs to be changed to the ratio so that you can run multiple currencies at the same time
The Little DreamIt's possible to design it, but it feels like it's a bigger risk, so it's written n=1.
The Little DreamYes, because the price difference between different trading pairs is so far apart that it is not intuitively possible to represent the price difference, it needs to be designed in percentages. If you want to continue to represent the price difference, you need to set an array parameter to set the price difference of these different varieties separately.