Nick Rypock trasero hacia atrás (NRTR)
El autor:¿ Qué pasa?, Fecha: 2022-05-25 18:14:32Las etiquetas:El NRTR
Este indicador fue inventado en 2001 por Konstantin Kopyrkin.
Kopyrkin -> Kopyr Kin -> Kin Kopyr -> Nik Rypok es el jefe de la policía de la ciudad de Kopyrkin.
La idea del indicador es similar a la salida de la lámpara, pero no implica el componente ATR y utiliza un porcentaje en su lugar.
Un canal de precios dinámico se utiliza para calcular el NRTR. Los cálculos involucran solo aquellos precios que están incluidos en la tendencia actual y excluyen los extremos relacionados con la tendencia anterior. El indicador siempre está a la misma distancia (en porcentaje) de los extremos alcanzados por los precios (por debajo del pico máximo para la tendencia alcista actual, por encima del fondo mínimo para la tendencia bajista actual).
Prueba posterior
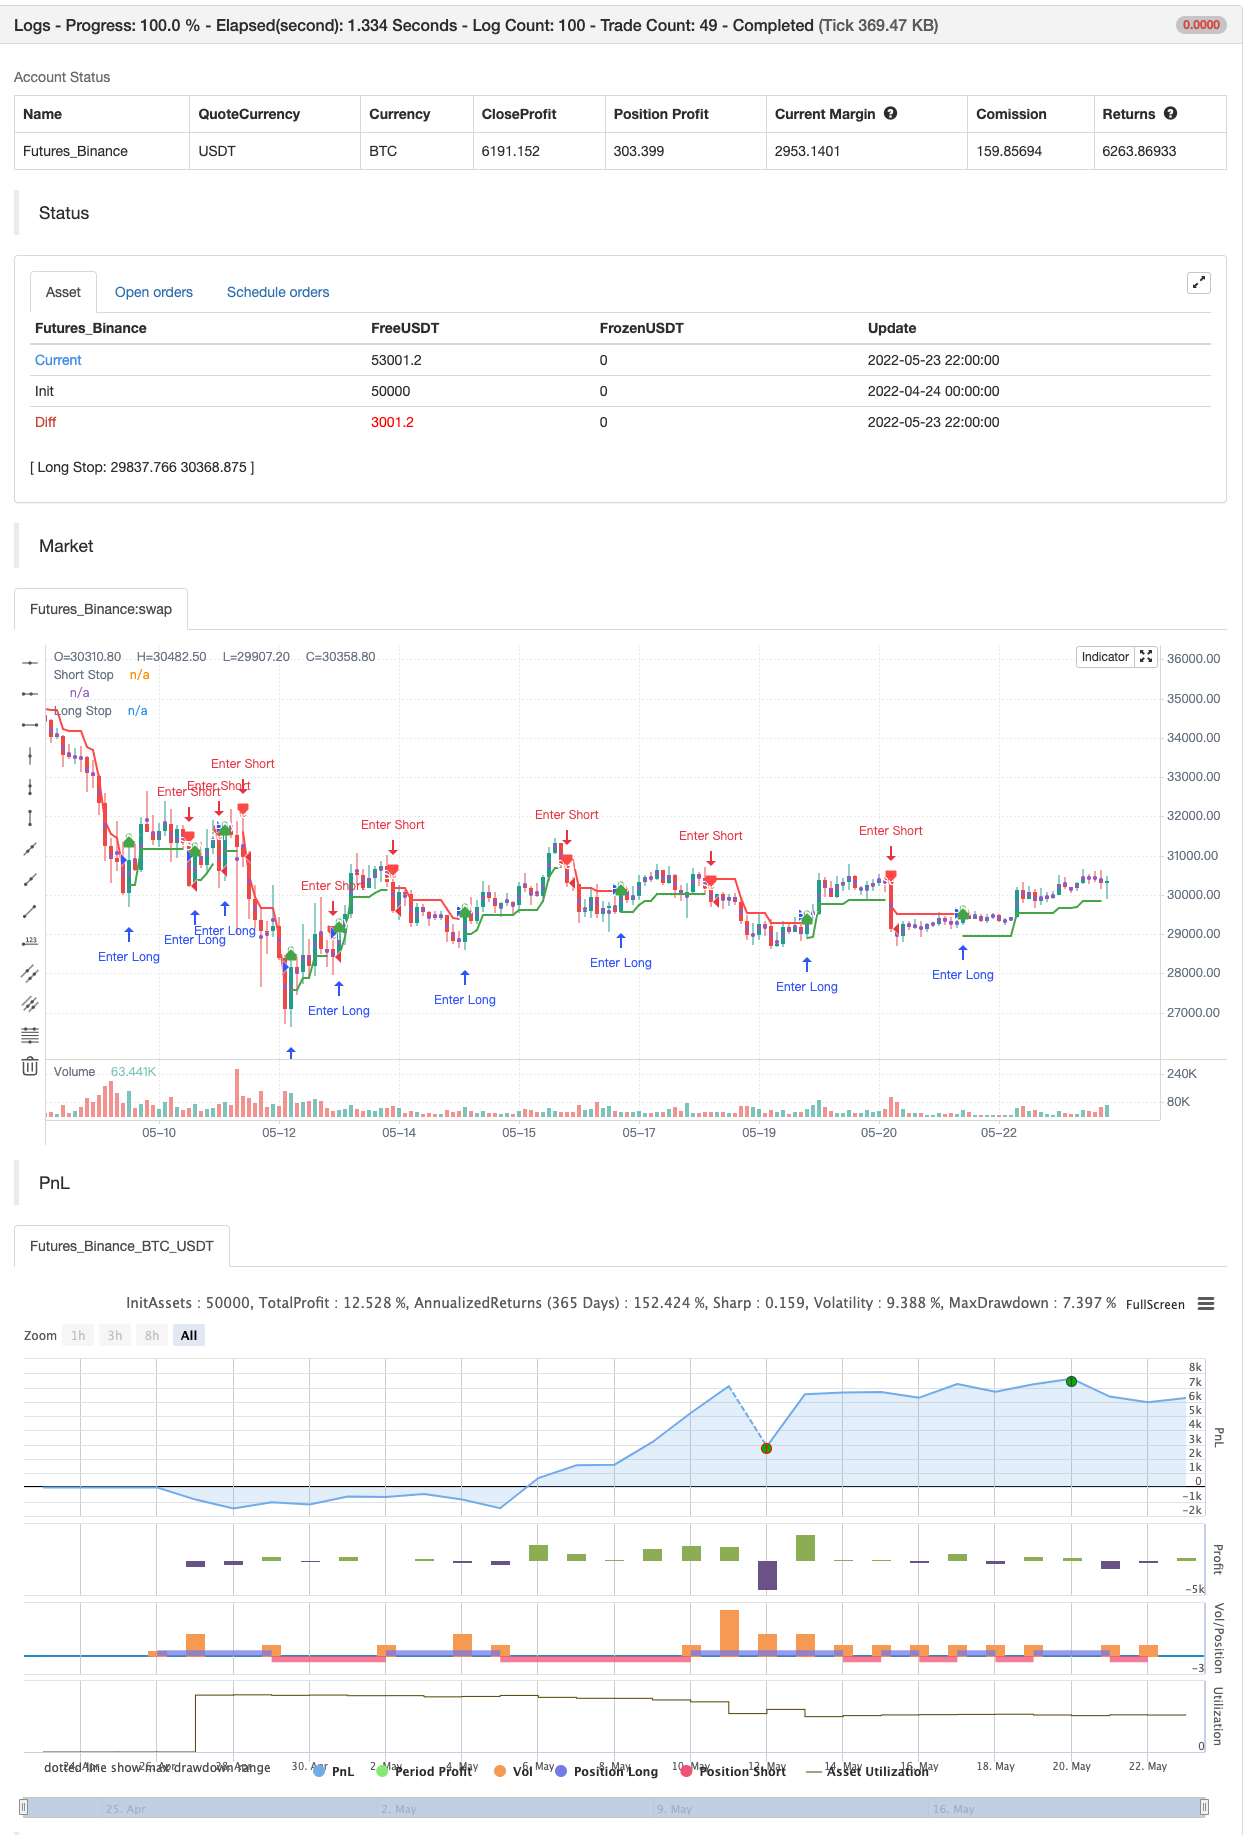
/*backtest
start: 2022-04-24 00:00:00
end: 2022-05-23 23:59:00
period: 2h
basePeriod: 15m
exchanges: [{"eid":"Futures_Binance","currency":"BTC_USDT"}]
*/

//@version=4
// Copyright (c) 2021-present, Alex Orekhov (everget)
study("Nick Rypock Trailing Reverse", shorttitle="NRTR", overlay=true)

k = input(title="Coefficient of Correction, %", type=input.float, minval=0, maxval=100, step=0.1, defval=2)
showLabels = input(title="Show Buy/Sell Labels ?", type=input.bool, defval=true)
applyRibbon = input(title="Apply Ribbon ?", type=input.bool, defval=true)

var int trend = 0
var float hp = close
var float lp = close
float nrtr = close

percentage = k * 0.01

if trend >= 0
	if close > hp
		hp := close
		hp
	nrtr := hp * (1 - percentage)
	if close <= nrtr
		trend := -1
		lp := close
		nrtr := lp * (1 + percentage)
		nrtr
else
	if close < lp
		lp := close
		lp
	nrtr := lp * (1 + percentage)
	if close > nrtr
		trend := 1
		hp := close
		nrtr := hp * (1 - percentage)
		nrtr

var color longColor = color.green
var color shortColor = color.red
var color textColor = color.white

longStopPlot = plot(trend == 1 ? nrtr : na, title="Long Stop", style=plot.style_linebr, linewidth=2, color=longColor)
buySignal = trend == 1 and trend[1] == -1
plotshape(buySignal ? nrtr : na, title="Long Stop Start", location=location.absolute, style=shape.circle, size=size.tiny, color=longColor, transp=0)
plotshape(buySignal and showLabels ? nrtr : na, title="Buy Label", text="Buy", location=location.absolute, style=shape.labelup, size=size.tiny, color=longColor, textcolor=textColor, transp=0)

shortStopPlot = plot(trend == 1 ? na : nrtr, title="Short Stop", style=plot.style_linebr, linewidth=2, color=shortColor)
sellSignal = trend == -1 and trend[1] == 1
plotshape(sellSignal ? nrtr : na, title="Short Stop Start", location=location.absolute, style=shape.circle, size=size.tiny, color=shortColor, transp=0)
plotshape(sellSignal and showLabels ? nrtr : na, title="Sell Label", text="Sell", location=location.absolute, style=shape.labeldown, size=size.tiny, color=shortColor, textcolor=textColor, transp=0)

midPricePlot = plot(ohlc4, title="", style=plot.style_circles, linewidth=0, display=display.none, editable=false)

longFillColor = applyRibbon ? (trend == 1 ? longColor : na) : na
shortFillColor = applyRibbon ? (trend == -1 ? shortColor : na) : na
fill(midPricePlot, longStopPlot, title="Long Ribbon", color=longFillColor)
fill(midPricePlot, shortStopPlot, title="Short Ribbon", color=shortFillColor)

changeCond = trend != trend[1]
alertcondition(changeCond, title="Alert: NRTR Direction Change", message="NRTR has changed direction!")
alertcondition(buySignal, title="Alert: NRTR Buy", message="NRTR Buy!")
alertcondition(sellSignal, title="Alert: NRTR Sell", message="NRTR Sell!")


if buySignal
    strategy.entry("Enter Long", strategy.long)
else if sellSignal
    strategy.entry("Enter Short", strategy.short)
- El valor de las operaciones de venta de valores de mercado se calculará en función de las operaciones de venta de valores.
- Divergencia de volumen
- Super Tendencia Diaria 2.0 BF
- Hull Moving Average Swing Trader (Tradador de movimiento de la media del casco)
- FTSMA - Tendencia es su amigo
- Filtro de rango Comprar y vender
- Canal SSL
- Estrategia de la suite del casco
- Parabólico SAR Comprar y vender
- El valor de las emisiones de gases de efecto invernadero es el valor de las emisiones de gases de efecto invernadero.
- ZigZag PA estrategia V4.1
- Venta y compra intradiarias
- Fractal roto: el sueño roto de alguien es su beneficio!
- Maximizador de ganancias PMax
- Una estrategia de victoria impecable
- Estocástico + RSI, doble estrategia
- Estrategia Swing Hull/rsi/EMA
- Instrumento de negociación de movimiento de cuero cabelludo R1-4
- La mejor estrategia de ingestión + escape
- Bollinger Awesome Alerta R1 en el momento en el que se produce el cambio