Stochastic + RSI, Double Strategy

1
Follow
1815
Followers
This strategy combines the classic RSI strategy to sell when the RSI increases over 70 (or to buy when it falls below 30), with the classic Stochastic Slow strategy to sell when the Stochastic oscillator exceeds the value of 80 (and to buy when this value is below 20).
This simple strategy only triggers when both the RSI and the Stochastic are together in a overbought or oversold condition. The one hour chart of the S&P 500 worked quite well recently with this double strategy.
By the way this strategy should not be confused with the 'Stochastic RSI', which measures the RSI only.
All trading involves high risk; past performance is not necessarily indicative of future results.
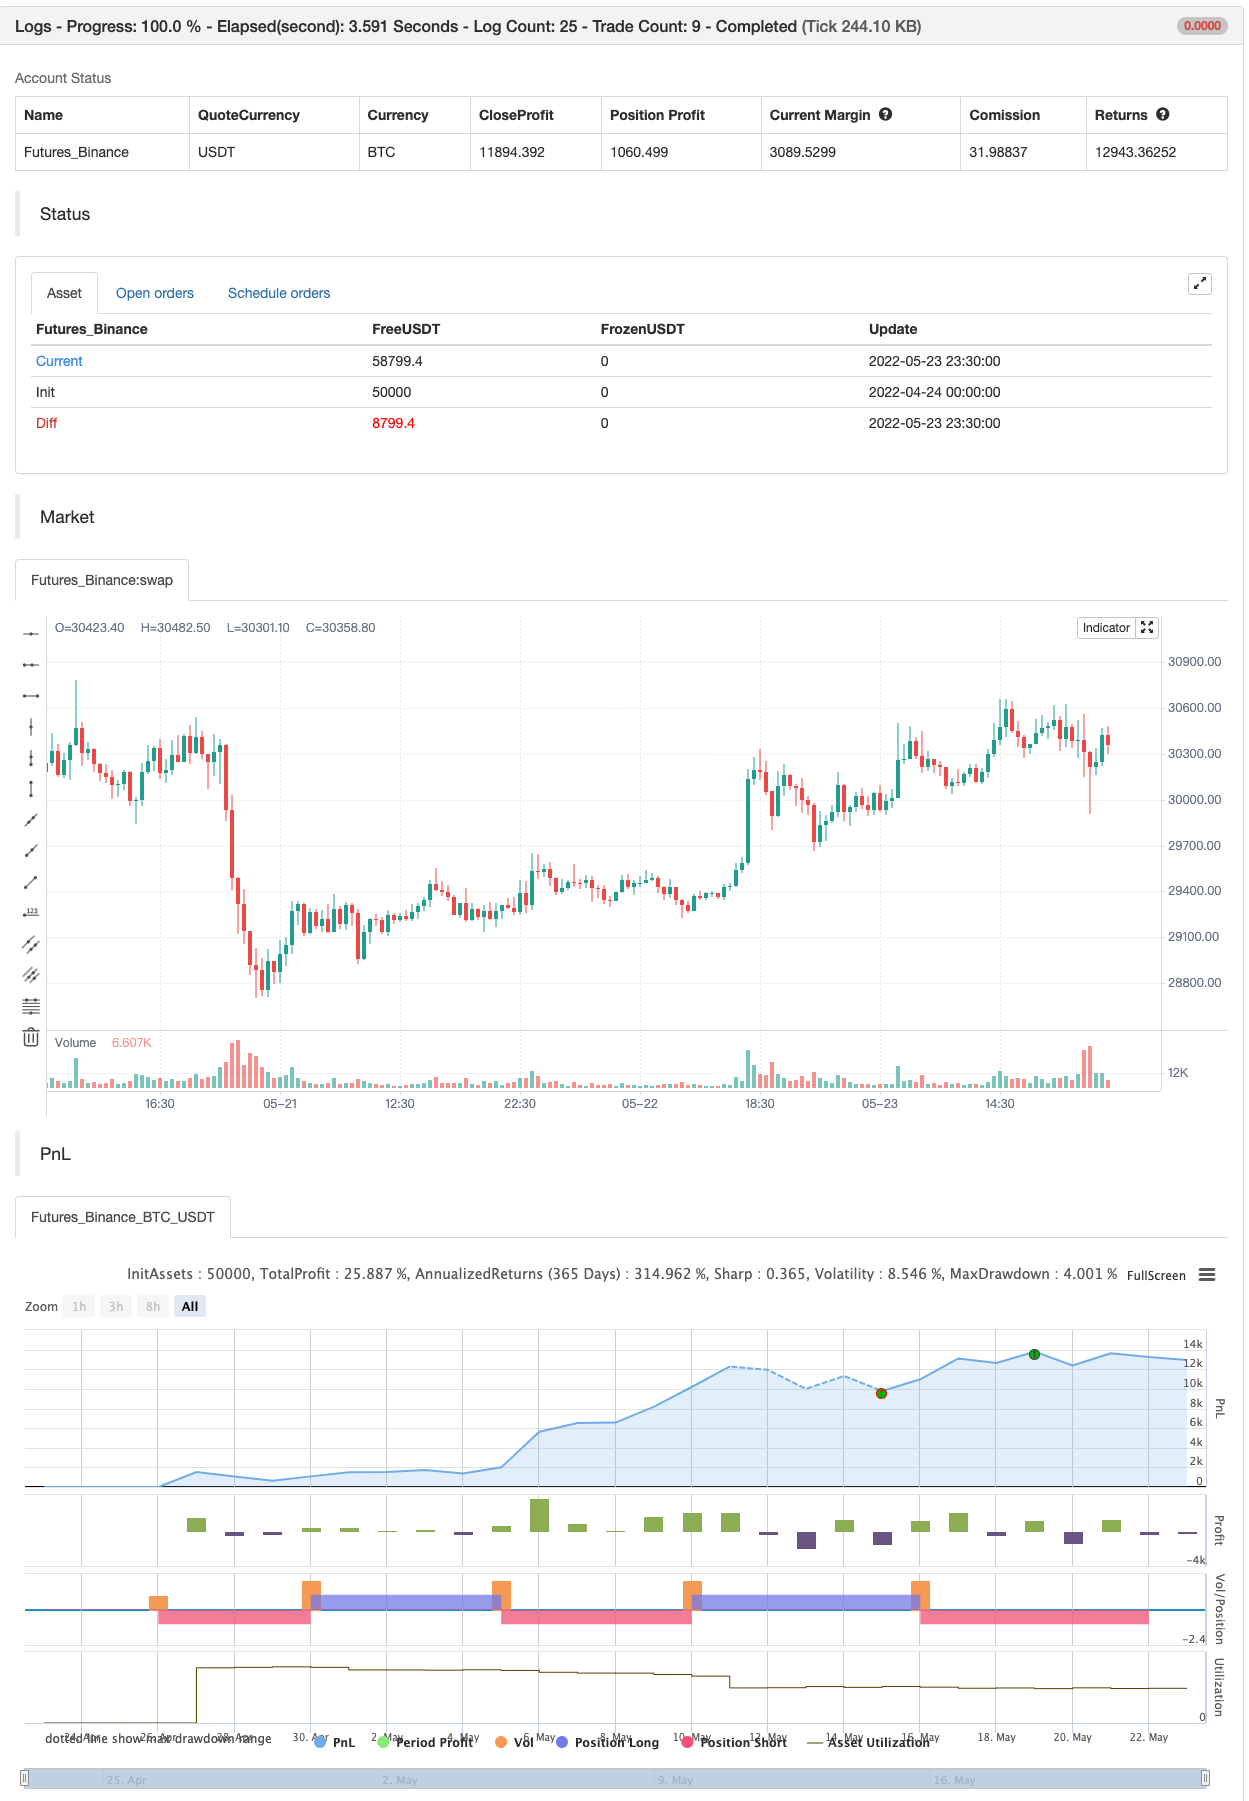
backtest
Source
Pine
/*backtest
start: 2022-04-24 00:00:00
end: 2022-05-23 23:59:00
period: 30m
basePeriod: 15m
exchanges: [{"eid":"Futures_Binance","currency":"BTC_USDT"}]
*/

//@version=2
strategy("Stochastic + RSI, Double Strategy (by ChartArt)", shorttitle="CA_-_RSI_Stoch_Strat", overlay=true)

// ChartArt's Stochastic Slow + Relative Strength Index, Double StrategyStrategy parameters
Related strategies
Comment
All comments (0)
No data
- 1