El valor de las operaciones de venta de valores de mercado se calculará en función de las operaciones de venta de valores.
El autor:¿ Qué pasa?, Fecha: 2022-05-26 17:11:01Las etiquetas:ADXEl RMAIndicador de riesgoEl EMALa SMALa WMA
Este es un indicador de estudio que muestra las entradas en la estrategia vista en uno de los canales de youtube por lo que no me pertenece. No puedo decir quién es porque es contra las Reglas de la Casa para anunciar, pero se puede averiguar si lo busca en youtube. Valores predeterminados de osciladores y ema ajustados como se sugirió. Dice que obtuvo los mejores resultados en un período de tiempo de 5 minutos, pero traté de hacer las cosas tan modificables como sea posible para que pueda jugar con los ajustes y crear su propia estrategia para diferentes períodos de tiempo si lo desea. Se sugiere usar con gráficos de velas normales. La línea azul de abajo indica que el ADX está por encima del umbral seleccionado establecido en la configuración llamada
La estrategia de entrada en sí es bastante sencilla. Las reglas de entrada son las siguientes, el script comprobará todo esto en automático y le dará una señal de compra o venta: Rango de tiempo recomendado: 5 min
Para las entradas largas:
- Compruebe si el precio está por encima de la EMA establecida (puede desactivar esta regla si lo desea en la configuración)
- El RSI está en sobreventa.
- ADX está por encima del umbral establecido
Trend Ready (significa que hay una tendencia en curso) - El precio debe aprobar la tendencia de las velas anteriores. Esto es alcista para las entradas de compra y bajista para las entradas de venta.
- Entrar con stop loss por debajo del último swing bajo con 1: 1 o 1,5: 1 tomar la relación de ganancias.
Para las entradas cortas:
- Compruebe si el precio está por debajo de la EMA establecida (Puede desactivar esta regla si lo desea en la configuración)
- RSI está en sobrecomprado
- ADX está por encima del umbral establecido
Trend Ready (significa que hay una tendencia en curso) - El precio debe aprobar la tendencia de las velas anteriores. Esto es alcista para las entradas de compra y bajista para las entradas de venta.
- Entra con stop loss por encima del último swing high con ratio de ganancia de 1: 1 o 1: 1.5: 1.
Este es mi primer indicador. Déjame saber si quieres alguna actualización. No estoy seguro de si puedo agregar todo, pero intentaré de todos modos.
Cambiado: las señales comprobarán hasta 2 velas antes si el RSI está por debajo o por encima del valor establecido para mostrar la señal.
Prueba posterior
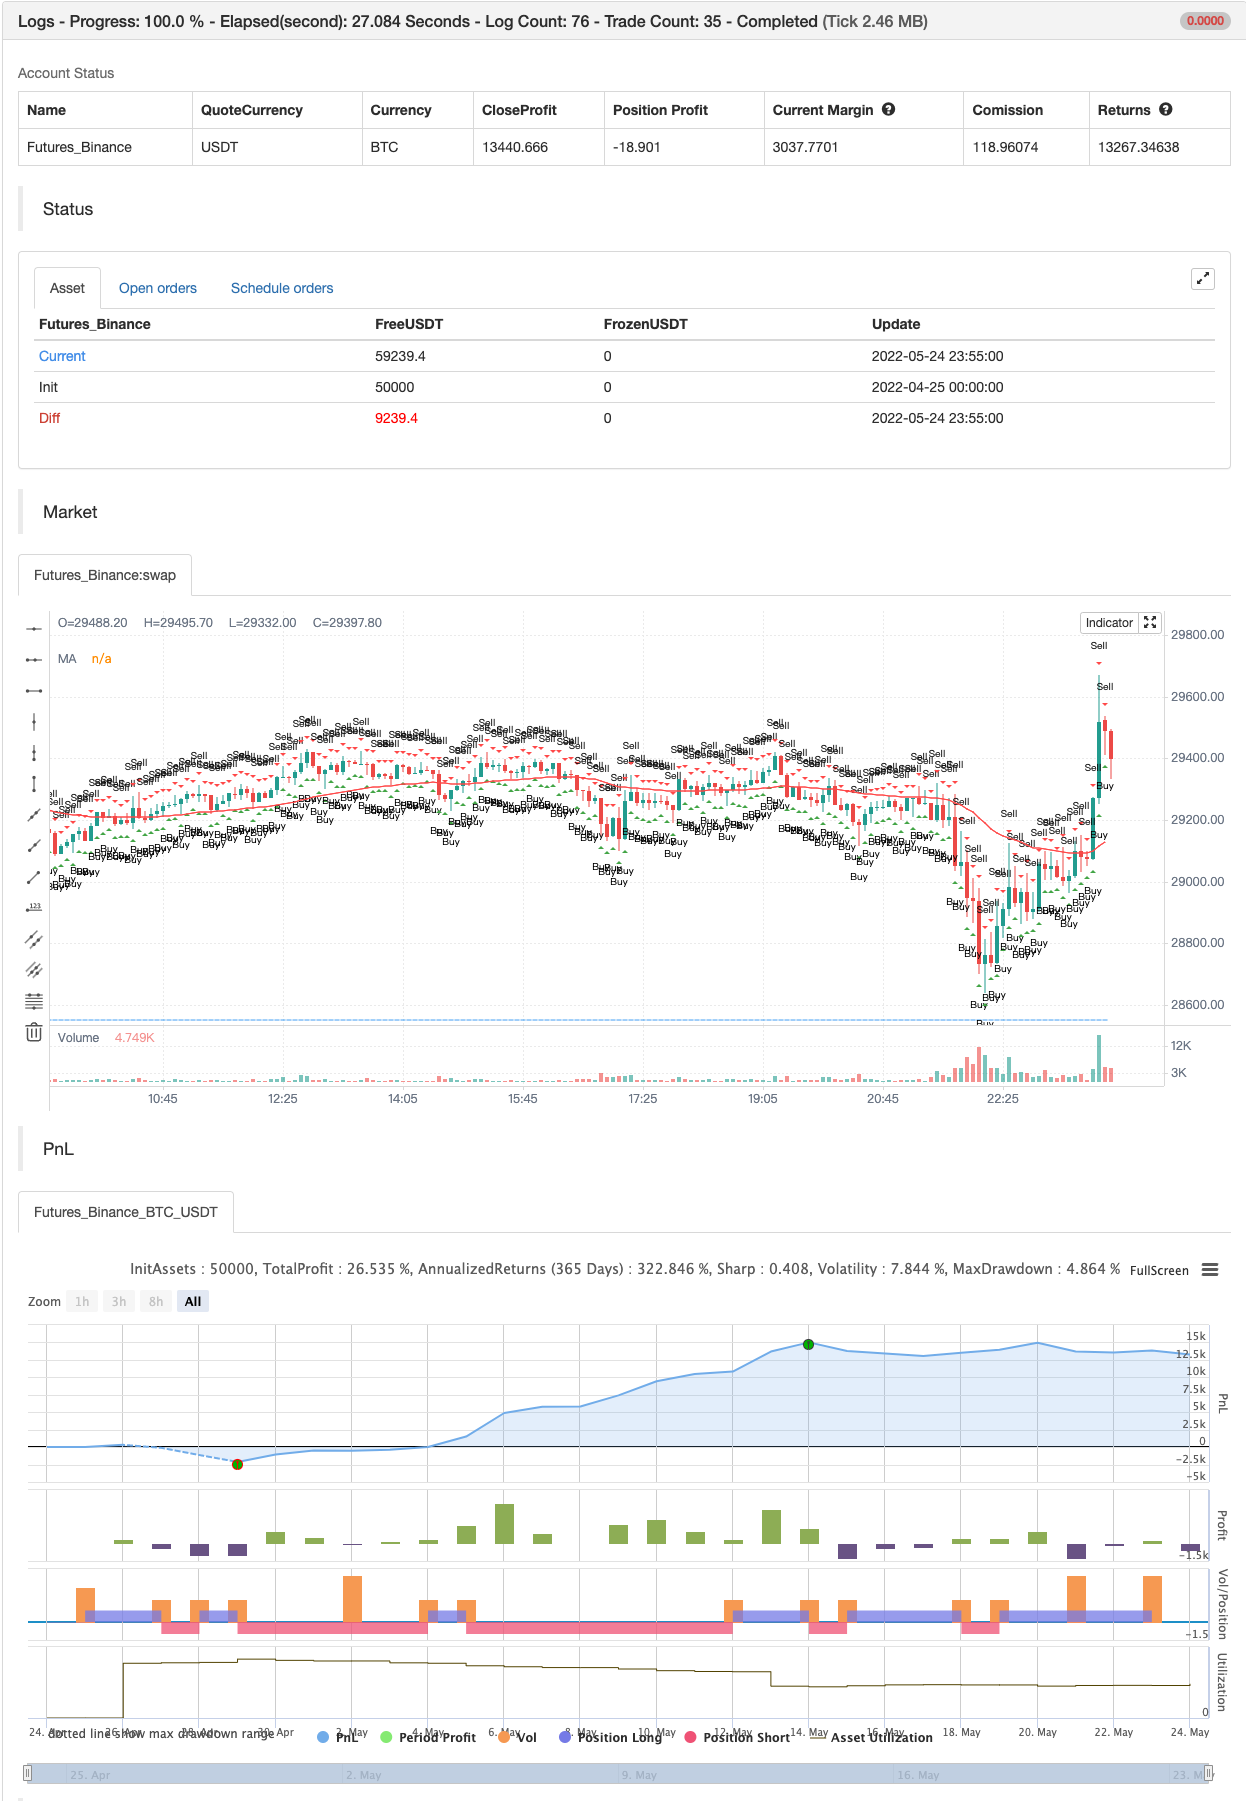
/*backtest
start: 2022-04-25 00:00:00
end: 2022-05-24 23:59:00
period: 5m
basePeriod: 1m
exchanges: [{"eid":"Futures_Binance","currency":"BTC_USDT"}]
*/

//@version=5
indicator(title='EMA RSI ADX Scalping Alerts', shorttitle="ERA Scalper", overlay=true)

//Define MA Inputs and group them
maType = input.string(title="MA Type", options=["EMA", "SMA", "WMA", "VWMA", "HMA", "RMA", "DEMA", "TEMA", "LSMA", "ZLSMA"], defval="EMA", group='MA Settings')
emaSource = input.source(title='MA Source', defval=close, group='MA Settings')
emaLength = input.int(title='MA Length', defval=50, minval=1, maxval=999, group='MA Settings')

//Other Moving Avarage Calculations
e1 = ta.ema(emaSource, emaLength)
e2 = ta.ema(e1, emaLength)
dema = 2 * e1 - e2

ema1 = ta.ema(emaSource, emaLength)
ema2 = ta.ema(ema1, emaLength)
ema3 = ta.ema(ema2, emaLength)
tema = 3 * (ema1 - ema2) + ema3

lsmaOffset = input.int(title="LSMA Offset", defval=0, minval=0, maxval=100, tooltip='Only used if you choose the LSMA and ZLSMA(Zero Lag LSMA) Option between MA Types', group='MA Settings')
lsma = ta.linreg(emaSource, emaLength, lsmaOffset)
lsma2 = ta.linreg(lsma, emaLength, lsmaOffset)
eq = lsma-lsma2
zlsma = lsma+eq

// Switch between different MA Types
emaValue = switch maType
    "EMA" => ta.ema(emaSource, emaLength)
    "SMA" => ta.sma(emaSource, emaLength)
    "WMA" => ta.wma(emaSource, emaLength)
    "VWMA" => ta.vwma(emaSource, emaLength)
    "HMA" => ta.hma(emaSource, emaLength)
    "RMA" => ta.rma(emaSource, emaLength)
    "DEMA" => dema
    "TEMA" => tema
    "LSMA" => lsma
    "ZLSMA" => zlsma
    =>
        runtime.error("No matching MA type found.")
        float(na)

//Define RSI inputs and group them
rsiSource = input.source(title='RSI Source', defval=close, group='RSI Settings')
rsiLength = input.int(title='RSI Length', defval=3, minval=0, maxval=100, group='RSI Settings')
rsiValuee = ta.rsi(rsiSource, rsiLength)
rsiOverbought = input.int(title='RSI Overbought Level', defval=80, group='RSI Settings')
rsiOversold = input.int(title='RSI Oversold Level', defval=20, group='RSI Settings')

//Define overbought and oversold conditions
isRsiOB = rsiValuee >= rsiOverbought
isRsiOS = rsiValuee <= rsiOversold

//ADX Inputs and calculation of the value
adxlen = input.int(5, title='ADX Smoothing', group='ADX Settings')
dilen = input.int(5, title='DI Length', group='ADX Settings')
dirmov(len) =>
    up = ta.change(high)
    down = -ta.change(low)
    plusDM = na(up) ? na : up > down and up > 0 ? up : 0
    minusDM = na(down) ? na : down > up and down > 0 ? down : 0
    truerange = ta.rma(ta.tr, len)
    plus = fixnan(100 * ta.rma(plusDM, len) / truerange)
    minus = fixnan(100 * ta.rma(minusDM, len) / truerange)
    [plus, minus]
adx(dilen, adxlen) =>
    [plus, minus] = dirmov(dilen)
    sum = plus + minus
    adx = 100 * ta.rma(math.abs(plus - minus) / (sum == 0 ? 1 : sum), adxlen)
    adx
sig = adx(dilen, adxlen)

//Define the input and value where it is considered that there is a trend going on
adxLimit = input.int(title='Trend Ready Limit', defval=30, minval=0, maxval=100, group='ADX Settings')
trendReady = sig > adxLimit

//Draw trend ready at the bottom of the chart for better viewing so that you can change the value based on what you see easier
plotADX = input(title='Draw Trend Ready On Chart', defval=false)
readyFold = plotADX and sig > adxLimit
plotchar(series=readyFold, title='Trend Ready', location=location.bottom, color=color.new(color.blue, 0), size=size.small, char='_')

//Plot the EMA on chart
enableEmaRule = input(title='Enable MA Rule', defval=true)

//Define the signal conditions and choice to add or leave out MA Rule if you wish so
alertLong = enableEmaRule ? low > emaValue and (rsiValuee <= rsiOversold or rsiValuee[1] <= rsiOversold or rsiValuee[2] <= rsiOversold) and sig > adxLimit and close > high[1] : (rsiValuee <= rsiOversold or rsiValuee[1] <= rsiOversold or rsiValuee[2] <= rsiOversold) and sig > adxLimit and close > high[1]
alertShort = enableEmaRule ? high < emaValue and (rsiValuee >= rsiOverbought or rsiValuee[1] >= rsiOverbought or rsiValuee[2] >= rsiOverbought) and sig > adxLimit and close < low[1] : (rsiValuee >= rsiOverbought or rsiValuee[1] >= rsiOverbought or rsiValuee[2] >= rsiOverbought) and sig > adxLimit and close < low[1]
plot(enableEmaRule ? emaValue : na, color=color.new(color.red, 0), title='MA')

//Buy and Sell Shapes on Chart
plotshape(alertLong, title='Buy', location=location.belowbar, color=color.new(color.green, 0), size=size.small, style=shape.triangleup, text='Buy')
plotshape(alertShort, title='Sell', location=location.abovebar, color=color.new(color.red, 0), size=size.small, style=shape.triangledown, text='Sell')

//Alerts
alertcondition(title='Buy Alert', condition=alertLong, message='Long Conditions are Met')
alertcondition(title='Sell Alert', condition=alertShort, message='Short Conditions are Met')
alertcondition(title='Buy / Sell Alert', condition=alertLong or alertShort, message='Conditions Met for Buy or Short')

if alertLong
    strategy.entry("Enter Long", strategy.long)
else if alertShort
    strategy.entry("Enter Short", strategy.short)
- Super Scalper - 5 Min 15 Min
- VWMA-ADX Momentum y estrategia larga de Bitcoin basada en tendencias
- Oscilador de arco iris
- Super Salto Volver hacia atrás Banda de Bollinger
- La AEVM
- El Super Scalper
- MACD más inteligente
- ZigZag basado en el impulso
- Estrategia dinámica de DCA basada en el volumen
- Teoría de las ondas de Elliott 4-9 Detección automática de ondas de impulso Estrategia de negociación
- Alto SAR bajo
- SuperTREX
- Detector de picos
- Buscador bajo
- Tendencia de la SMA
- Bajos de Bollinger
- Super tendencia B
- SIGNALES de cambio
- Ciclo de tendencia de Schaff
- 72s: promedio móvil del casco adaptativo +
- Divergencia de volumen
- Super Tendencia Diaria 2.0 BF
- Hull Moving Average Swing Trader (Tradador de movimiento de la media del casco)
- FTSMA - Tendencia es su amigo
- Filtro de rango Comprar y vender
- Canal SSL
- Estrategia de la suite del casco
- Parabólico SAR Comprar y vender
- El valor de las emisiones de gases de efecto invernadero es el valor de las emisiones de gases de efecto invernadero.
- Nick Rypock trasero hacia atrás (NRTR)