Démonstration de KLineChart

12
Follow
656
Followers
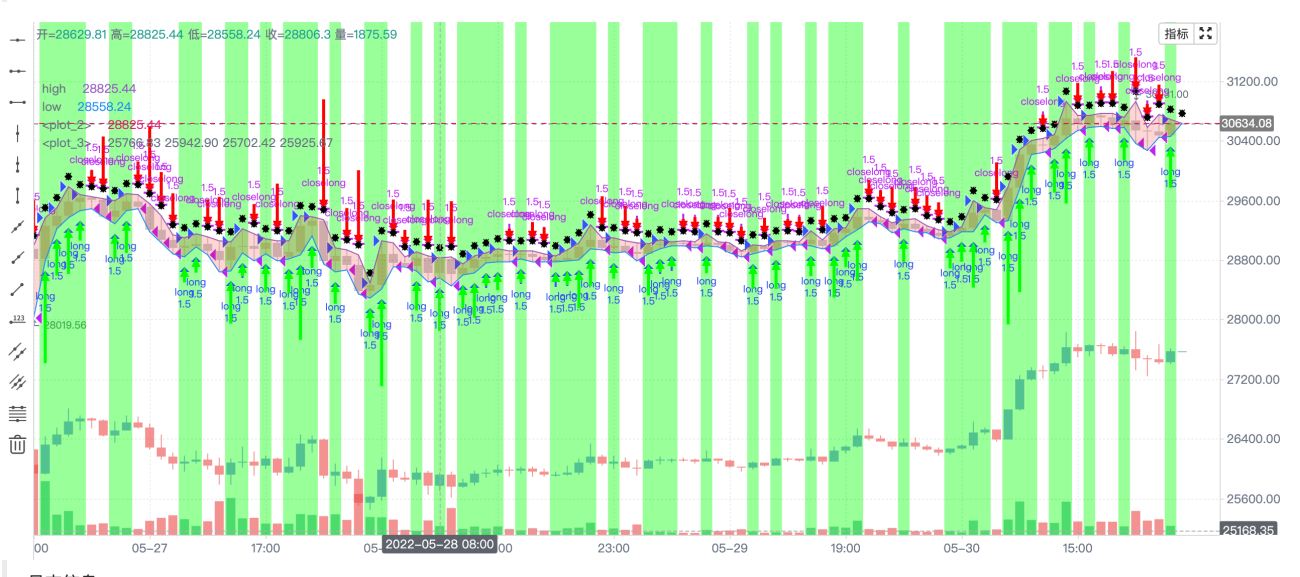
La plateforme (langages Javascript/Python) prend en charge KLineChart, toutes les fonctions de dessin du langage Pine (paramètres identiques), et les signaux d'achat/vente personnalisés.
Voici un exemple de démonstration.
Documentation de référence : https://www.fmz.com/api#klinechart
Source
JavaScript
Related strategies
Comment
All comments (0)
No data
- 1