सुपर स्केलर
लेखक:चाओझांग, दिनांकः 2022-05-17 14:23:28टैगःआरएमएएसएमएईएमएडब्ल्यूएमएएटीआर
यह रणनीति आरएसआई और एटीआर बैंड पर आधारित है जो 5 और 15 मिनट के समय सीमा में बेहतर काम करती है। वास्तविक समय में उपयोग करने से पहले 1:2R के साथ पर्याप्त बैक टेस्ट करें।
केवल स्क्रीन प्रतीकों पर व्यापार पर प्रवेश करें, लाभ बुक करने या SL को ट्रैक करने के लिए अतिरिक्त खरीद/बिक्री अलर्ट का उपयोग करें।
मैंने प्रवृत्ति की पुष्टि के लिए 65 और 21 ईएमए के गोल्डन क्रॉस ओवर को भी जोड़ा है।
बैकटेस्ट
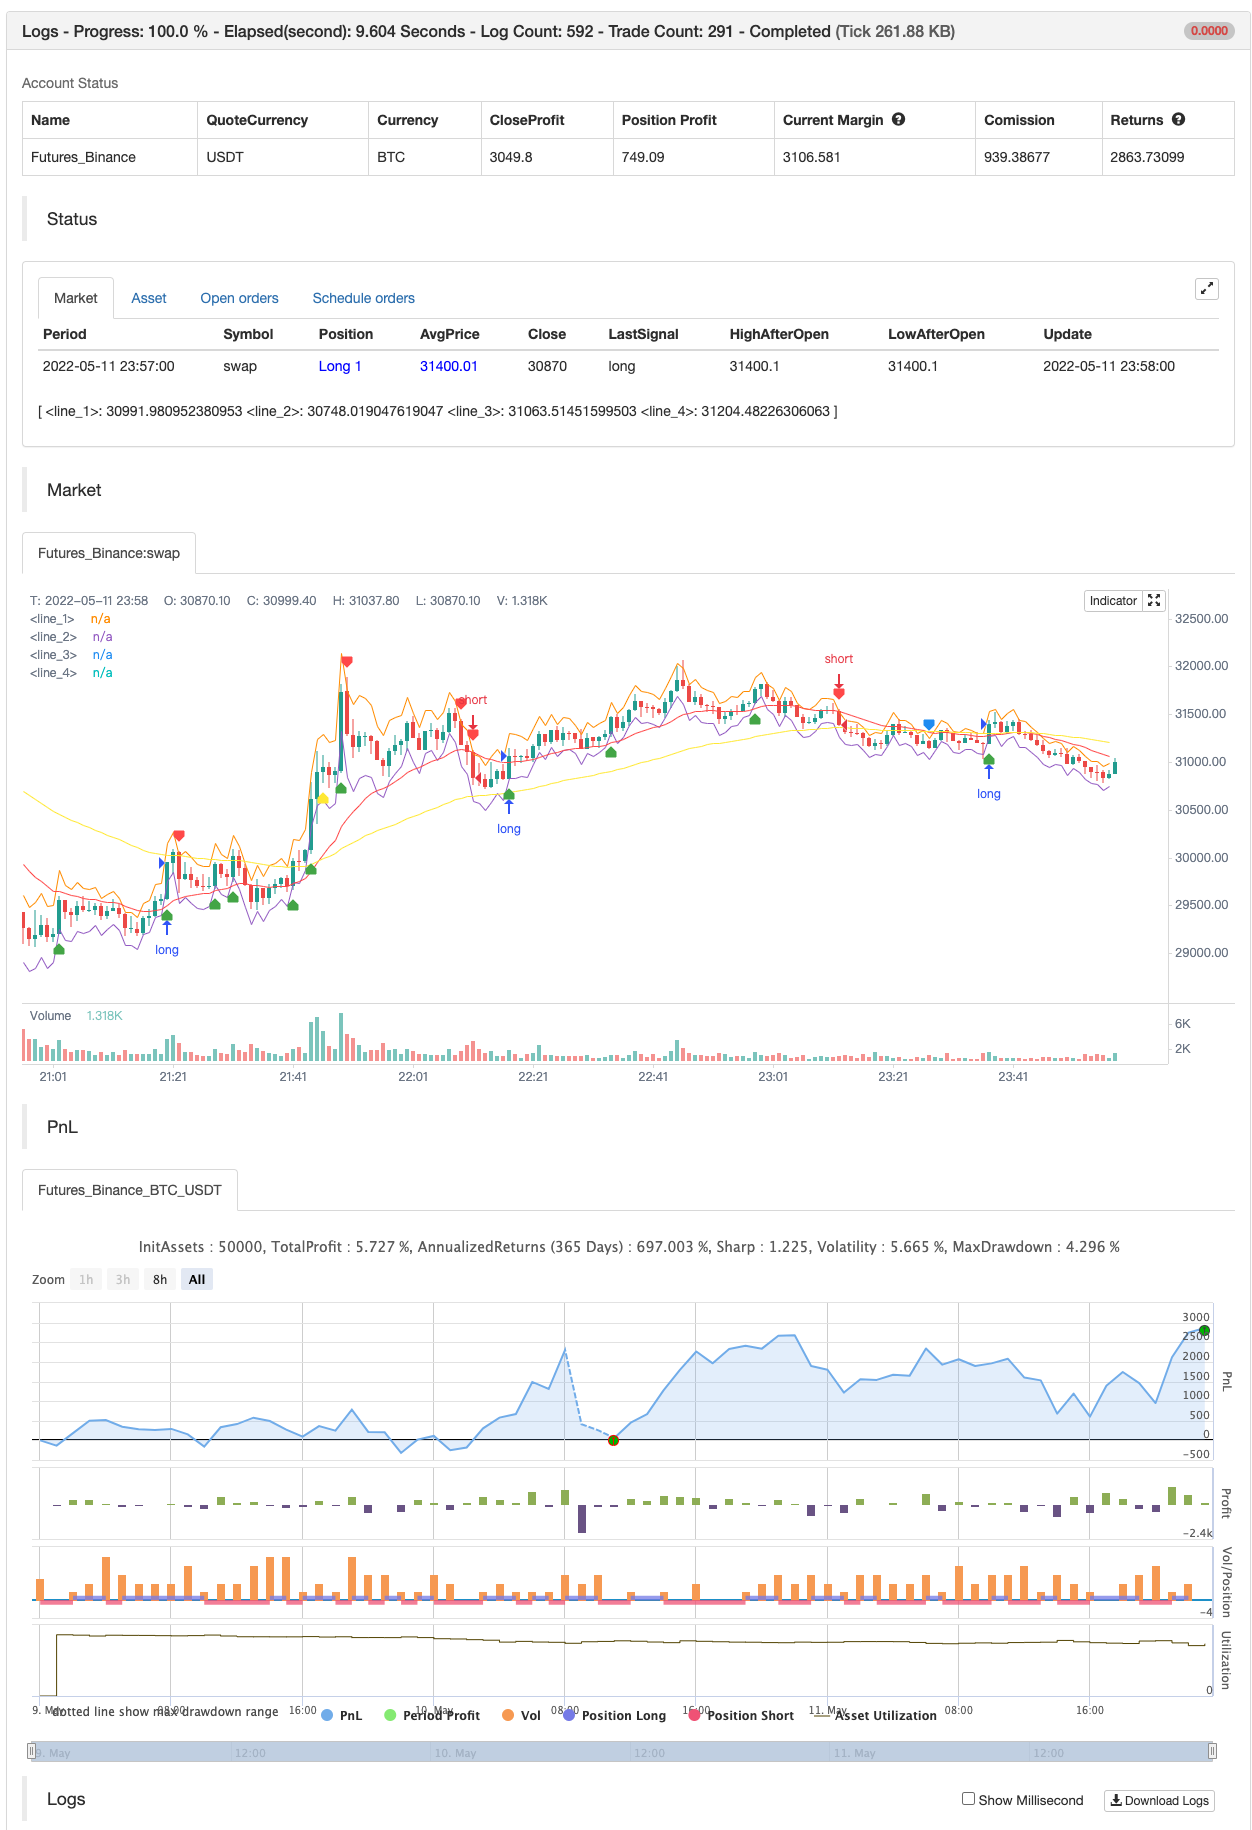
/*backtest
start: 2022-05-09 00:00:00
end: 2022-05-11 23:59:00
period: 1m
basePeriod: 1m
exchanges: [{"eid":"Futures_Binance","currency":"BTC_USDT"}]
*/

//@version=4
strategy("Super Scalper - 5 Min 15 Min", overlay=true)
source = close
atrlen = input(14, "ATR Period")
mult = input(1, "ATR Multi", step=0.1)
smoothing = input(title="ATR Smoothing", defval="WMA", options=["RMA", "SMA", "EMA", "WMA"])
ma_function(source, atrlen) =>
    if smoothing == "RMA"
        rma(source, atrlen)
    else
        if smoothing == "SMA"
            sma(source, atrlen)
        else
            if smoothing == "EMA"
                ema(source, atrlen)
            else
                wma(source, atrlen)
atr_slen = ma_function(tr(true), atrlen)
upper_band = atr_slen * mult + close
lower_band = close - atr_slen * mult

// Create Indicator's
shortSMA = ema(close, 21)
longSMA = ema(close, 65)
rsi = rsi(close, 14)
atr = atr(14)

// Specify  conditions
longCondition = open < lower_band
shortCondition = open > upper_band
GoldenLong = crossover(shortSMA,longSMA)
Goldenshort = crossover(longSMA,shortSMA)

plotshape(shortCondition, title="Sell Label", text="Sell", location=location.abovebar, style=shape.labeldown, size=size.tiny, color=color.red, textcolor=color.white, transp=0)
plotshape(longCondition, title="Buy Label", text="Buy", location=location.belowbar, style=shape.labelup, size=size.tiny, color=color.green, textcolor=color.white, transp=0)
plotshape(Goldenshort, title="Golden Sell Label", text="Golden Crossover Short", location=location.abovebar, style=shape.labeldown, size=size.tiny, color=color.blue, textcolor=color.white, transp=0)
plotshape(GoldenLong, title="Golden Buy Label", text="Golden Crossover Long", location=location.belowbar, style=shape.labelup, size=size.tiny, color=color.yellow, textcolor=color.white, transp=0)
// Execute trade if condition is True
if (longCondition)
    stopLoss = low - atr * 2
    takeProfit = high + atr * 5
    strategy.entry("long", strategy.long, when = rsi > 50)


else if (shortCondition)
    stopLoss = high + atr * 2
    takeProfit = low - atr * 5
    strategy.entry("short", strategy.short, when = rsi < 50)


// Plot ATR bands to chart

////ATR Up/Low Bands

plot(upper_band)
plot(lower_band)

// Plot Moving Averages
plot(shortSMA, color = color.red)
plot(longSMA, color = color.yellow)
संबंधित
- सुपरजंप टर्न बैक बोलिंगर बैंड
- ईएसएसएमए
- सुपर स्केलर - 5 मिनट 15 मिनट
- एसएसएल हाइब्रिड
- इंद्रधनुष दोलन
- स्मार्ट एमएसीडी
- खरीद/बिक्री के साथ ईएमए एडीएक्स आरएसआई का स्केलिंग
- सुपरट्रेंड चलती औसत
- मुनाफा अधिकतम करनेवाला PMax
- गति-आधारित ज़िगज़ैग
अधिक
- जॉनी के बॉट
- एसएसएल हाइब्रिड
- झूमर से बाहर निकलना
- रिज़ोट्टो
- ईएमए क्लाउड इंट्राडे रणनीति
- पिवोट पॉइंट सुपरट्रेंड
- सुपरट्रेंड+4चल रहा है
- गति-आधारित ज़िगज़ैग
- VuManChu Cipher B + Divergences रणनीति
- अवधारणा दोहरी सुपरट्रेंड
- बैकटेस्टिंग- सूचक
- ट्रेंडिलियस
- एसएमए बीटीसी हत्यारा
- एमएल अलर्ट टेम्पलेट
- ब्रेक के साथ फिबोनाची प्रगति
- आरएसआई एमटीएफ ओबी+ओ
- फुकुइज़ ऑक्टा-ईएमए + इचिमोकू
- सीसीआई एमटीएफ ओबी+ओ
- स्मार्ट एमएसीडी
- ओसीसी रणनीति आर5.1