2021年のデジタル通貨市場の見直しと最もシンプルな10倍戦略の見逃し
作者: リン・ハーンリディア作成日:2022年10月26日 16:12:49 更新日:2023年9月15日 20:41:17
2021年の概要と将来の戦略
2021年は終わりに近づいており,DEFIからGAMEFIまでのホットスポットが無限の流れで現れ,市場全体はまだ牛市場です.今振り返ってまとめましょう. 2021年にどのくらいの利益を上げましたか? どんな機会を逃しました? 成功した投資は何でしたか? 最近,私は過去年の歴史的な市場を見て,多通貨指数である予想外のシンプルな利潤戦略を発見しました.
取引所には多くの通貨があり,その多くは未知になり,取引から引き上げることもあります. ここでは,市場で使用されてきたBinance永続契約の通貨を選択します. これらは一般的にテストされ,比較的安全である主流通貨として認識されています. 簡単なスクリーニングの後,いくつかのインデックス通貨は削除され,最終的に134の通貨が得られました.
[1] において
import requests
from datetime import date,datetime
import time
import pandas as pd
import numpy as np
import matplotlib.pyplot as plt
%matplotlib inline
[144]:
## Current trading pairs
Info = requests.get('https://fapi.binance.com/fapi/v1/exchangeInfo')
symbols = [s['symbol'] for s in Info.json()['symbols']]
[154]:
symbols_f = list(set(filter(lambda x: x[-4:] == 'USDT', [s.split('_')[0] for s in symbols]))-
                 set(['1000SHIBUSDT','1000XECUSDT','BTCDOMUSDT','DEFIUSDT','BTCSTUSDT'])) + ['SHIBUSDT','XECUSDT']
print(symbols_f)
[155]:
print(len(symbols_f))
過去年の市場
数字を標準化することで計算できます. 標準化によって計算できます. 標準化によって計算できます. 標準化によって計算できます.
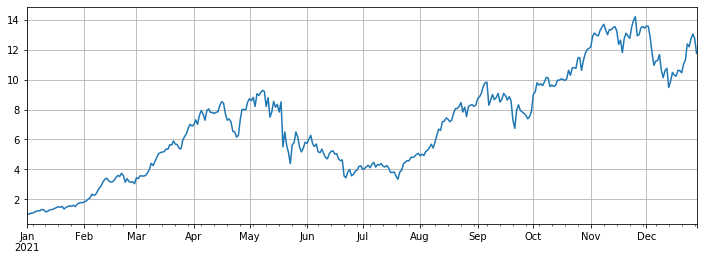
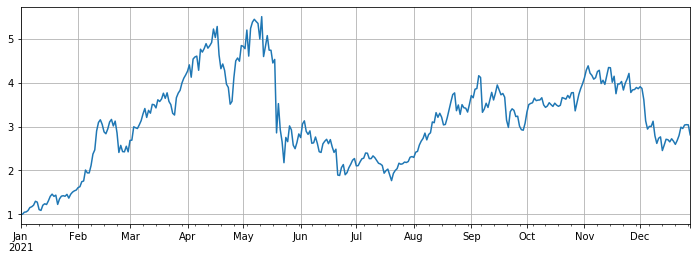
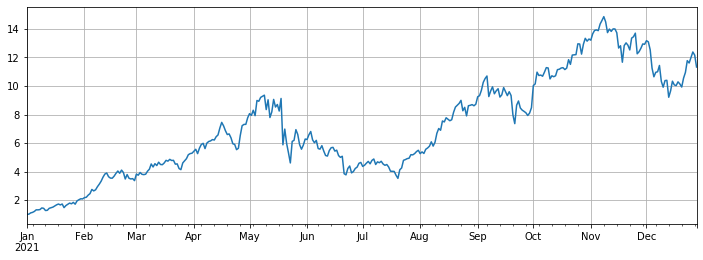
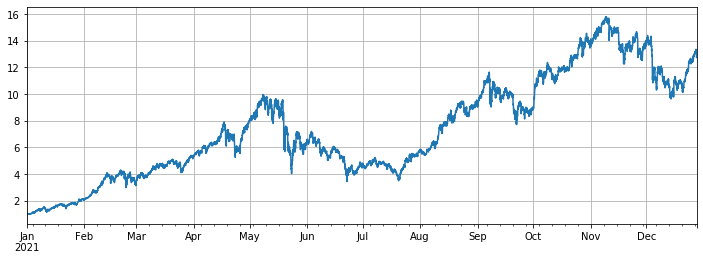
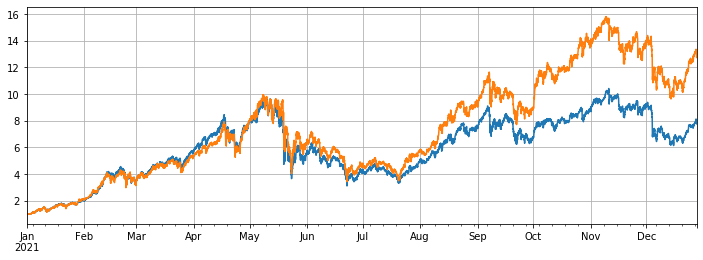
最終インデックスリターンは約12倍,つまり2021年1月1日に平均で134枚のコインを購入すると,何もしない最終リターンは12倍になる.トレーダーの90%以上が平均インデックスを上回らないと推定される.その中でも,最も下落した通貨は:ICPが93%下落,DODOが85%,LINAが75%下落した.SOL,FTM,LUNA,MATIC,SAND,AXSはほぼ100倍上昇した.その中でも,AXSは168倍上昇し,最大のダークホースとなった.メディアンは3倍増加し,主に公開チェーンとゲームによって引き起こされた.生存偏見を回避するために,我々は期間中に永続的な新しい通貨を除外し,利益のほぼ11倍を達成した.これはBTCの利益の7倍である.
これは絶望的な利回り率です.私はあらゆる種類の戦略を作るために懸命に働きましたが,それは1年に何もしない利益から遠く離れていました.しかし,特定の上昇の一部が大きすぎており,インデックスから明らかに逸脱していることに注意してください.これらの通貨が年の初めに選択されていない場合,利益は,はるかに利益が少ない中位値に近いでしょう.
[157]:
#Obtain the function of K-line in any period
def GetKlines(symbol='BTCUSDT',start='2020-8-10',end='2021-8-10',period='1h',base='fapi',v = 'v1'):
    Klines = []
    start_time = int(time.mktime(datetime.strptime(start, "%Y-%m-%d").timetuple()))*1000 + 8*60*60*1000
    end_time = int(time.mktime(datetime.strptime(end, "%Y-%m-%d").timetuple()))*1000 + 8*60*60*1000
    intervel_map = {'m':60*1000,'h':60*60*1000,'d':24*60*60*1000}
    while start_time < end_time:
        mid_time = min(start_time+1000*int(period[:-1])*intervel_map[period[-1]],end_time)
        url = 'https://'+base+'.binance.com/'+base+'/'+v+'/klines?symbol=%s&interval=%s&startTime=%s&endTime=%s&limit=1000'%(symbol,period,start_time,mid_time)
        res = requests.get(url)
        res_list = res.json()
        if type(res_list) == list and len(res_list) > 0:
            start_time = res_list[-1][0]
            Klines += res_list
        elif type(res_list) == list:
            start_time = start_time+1000*int(period[:-1])*intervel_map[period[-1]]
        else:
            break

    df = pd.DataFrame(Klines,columns=['time','open','high','low','close','amount','end_time','volume','count','buy_amount','buy_volume','null']).astype('float')
    df.index = pd.to_datetime(df.time,unit='ms')
    return df
[164]:
df_all_s = pd.DataFrame(index=pd.date_range(start='2021-1-1', end='2021-12-28', freq='1d'),columns=symbols_s)
for i in range(len(symbols_f)):
    #print(symbols_s[i])
    symbol_s = symbols_f[i]
    df_s = GetKlines(symbol=symbol_s,start='2021-1-1',end='2021-12-28',period='1d',base='api',v='v3')
    df_all_s[symbol_s] = df_s[~df_s.index.duplicated(keep='first')].close
[165]:
df_all_s.tail() #data structure
出場[165]:
[174]:
df_all = df_all_s.fillna(method='bfill')#filled data
df_norm = df_all/df_all.iloc[0] #normalization
df_norm.mean(axis=1).plot(figsize=(12,4),grid=True);
#The final index return chart
アウト[1]:
[175]:
#The median increase
df_norm.median(axis=1).plot(figsize=(12,4),grid=True);
アウト[1]:
[168]:
#Ranking for increase/decrease
print(df_norm.iloc[-1].round(2).sort_values().to_dict())
[317]:
#Maximum rollback of current price compared with the highest point in the year
print((1-df_norm.iloc[-1]/df_norm.max()).round(2).sort_values().to_dict())
[177]では:
df_all_f = pd.DataFrame(index=pd.date_range(start='2021-1-1', end='2021-12-28', freq='1d'),columns=symbols_s)
for i in range(len(symbols_f)):
    #print(symbols_s[i])
    symbol_f = symbols_f[i]
    df_f = GetKlines(symbol=symbol_f,start='2021-1-1',end='2021-12-28',period='1d',base='fapi',v='v1')
    df_all_f[symbol_f] = df_f[~df_f.index.duplicated(keep='first')].close
[208] で:
#Excluding new currency
df = df_all_s[df_all_s.columns[~df_all_f.iloc[0].isnull()]]
df = df.fillna(method='bfill')
df = df/df.iloc[0]
df.mean(axis=1).plot(figsize=(12,4),grid=True);
外[208]:
[212]:
#Compared with Bitcoin
(df.mean(axis=1)/df.BTCUSDT).plot(figsize=(12,4),grid=True);
出場 [1]:
[213]:
#Use the original backtest engine
class Exchange:

    def __init__(self, trade_symbols, fee=0.0004, initial_balance=10000):
        self.initial_balance = initial_balance #Initial assets
        self.fee = fee
        self.trade_symbols = trade_symbols
        self.account = {'USDT':{'realised_profit':0, 'unrealised_profit':0, 'total':initial_balance, 'fee':0}}
        for symbol in trade_symbols:
            self.account[symbol] = {'amount':0, 'hold_price':0, 'value':0, 'price':0, 'realised_profit':0,'unrealised_profit':0,'fee':0}

    def Trade(self, symbol, direction, price, amount):

        cover_amount = 0 if direction*self.account[symbol]['amount'] >=0 else min(abs(self.account[symbol]['amount']), amount)
        open_amount = amount - cover_amount
        self.account['USDT']['realised_profit'] -= price*amount*self.fee #Deduct the handling fee
        self.account['USDT']['fee'] += price*amount*self.fee
        self.account[symbol]['fee'] += price*amount*self.fee

        if cover_amount > 0: #Close the position first
            self.account['USDT']['realised_profit'] += -direction*(price - self.account[symbol]['hold_price'])*cover_amount  #Profits
            self.account[symbol]['realised_profit'] += -direction*(price - self.account[symbol]['hold_price'])*cover_amount

            self.account[symbol]['amount'] -= -direction*cover_amount
            self.account[symbol]['hold_price'] = 0 if self.account[symbol]['amount'] == 0 else self.account[symbol]['hold_price']

        if open_amount > 0:
            total_cost = self.account[symbol]['hold_price']*direction*self.account[symbol]['amount'] + price*open_amount
            total_amount = direction*self.account[symbol]['amount']+open_amount

            self.account[symbol]['hold_price'] = total_cost/total_amount
            self.account[symbol]['amount'] += direction*open_amount


    def Buy(self, symbol, price, amount):
        self.Trade(symbol, 1, price, amount)

    def Sell(self, symbol, price, amount):
        self.Trade(symbol, -1, price, amount)

    def Update(self, close_price): #Update the assets
        self.account['USDT']['unrealised_profit'] = 0
        for symbol in self.trade_symbols:
            self.account[symbol]['unrealised_profit'] = (close_price[symbol] - self.account[symbol]['hold_price'])*self.account[symbol]['amount']
            self.account[symbol]['price'] = close_price[symbol]
            self.account[symbol]['value'] = abs(self.account[symbol]['amount'])*close_price[symbol]
            self.account['USDT']['unrealised_profit'] += self.account[symbol]['unrealised_profit']
        self.account['USDT']['total'] = round(self.account['USDT']['realised_profit'] + self.initial_balance + self.account['USDT']['unrealised_profit'],6)
[418]:
#The hourly K-line was taken to make the backtest more accurate
df_all_s = pd.DataFrame(index=pd.date_range(start='2021-1-1', end='2021-12-28', freq='1h'),columns=symbols_s)
for i in range(len(symbols_f)):
    #print(symbols_s[i])
    symbol_s = symbols_f[i]
    df_s = GetKlines(symbol=symbol_s,start='2021-1-1',end='2021-12-28',period='1h',base='api',v='v3')
    df_all_s[symbol_s] = df_s[~df_s.index.duplicated(keep='first')].close
[419]:
df = df_all_s[df_all_s.columns[~df_all_f.iloc[0].isnull()]]
df = df.fillna(method='bfill')
df = df/df.iloc[0]
df.mean(axis=1).plot(figsize=(12,4),grid=True);
外出[419]:
バランスのとれた戦略の実行
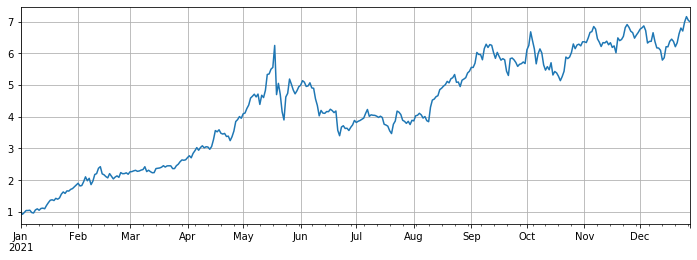
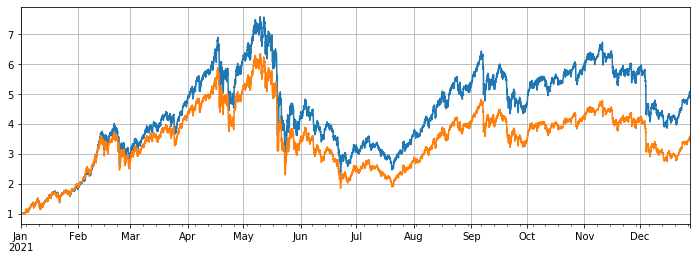
バックテストでは,2021年1月1日のオンラインバイナンス永続契約のすべての通貨が選択されました.Kライン期間は1hでした. ポジションが平均値より5%低いときにパラメータはポジションをスケーリングし,ポジションが5%以上のときにそれらを販売し始めました. バックテストではすべての通貨が,最終戦略的リターンは7.7倍です.明らかに平均リターンは13倍ほどではありません. これはまた予想されます. 結局,100倍上昇したいくつかの通貨はあまりにも特別で,バランス戦略はそれらをすべて販売します.
最も上昇した10つの通貨をバックテストから取り除くと,比較的中等な通貨のみが考慮され,最終収入は4.8倍になり,平均3.4倍の業績をはるかに上回ります.
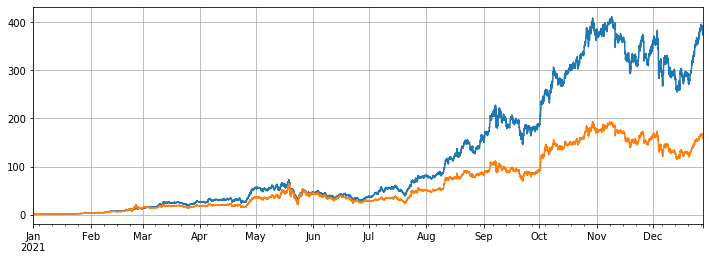
最も上昇した3つの通貨のみを回転させると,最終利益は 373倍になります.これは平均業績の160倍よりもはるかに多いです.これは,選択された回転通貨の傾向と上昇が一貫している場合,回転した結果は,何もしないよりもはるかに良いことを示しています.
[494]:
#Full currency backtest
symbols = list(df.iloc[-1].sort_values()[:].index)
e = Exchange(symbols, fee=0.001, initial_balance=10000)
res_list = []
avg_pct = 1/len(symbols)
for row in df[symbols].iterrows():
    prices = row[1]
    total = e.account['USDT']['total']
    e.Update(prices)
    for symbol in symbols:
        pct = e.account[symbol]['value']/total
        if pct < 0.95*avg_pct:
            e.Buy(symbol,prices[symbol],(avg_pct-pct)*total/prices[symbol])
        if pct > 1.05*avg_pct:
            e.Sell(symbol,prices[symbol],(pct-avg_pct)*total/prices[symbol])
    res_list.append([e.account[symbol]['value'] for symbol in symbols] + [e.account['USDT']['total']])
res = pd.DataFrame(data=res_list, columns=symbols+['total'],index = df.index)
[495]:
e.account['USDT']
外出[495]:
[496]:
# Backtest performance of full currencies
(res.total/10000).plot(figsize=(12,4),grid = True);
df[symbols].mean(axis=1).plot(figsize=(12,4),grid=True);
外出[496]:
[498]:
#Remove currencies with huge growth
symbols = list(df.iloc[-1].sort_values()[:-10].index)
e = Exchange(symbols, fee=0.001, initial_balance=10000)
res_list = []
avg_pct = 1/len(symbols)
for row in df[symbols].iterrows():
    prices = row[1]
    total = e.account['USDT']['total']
    e.Update(prices)
    for symbol in symbols:
        pct = e.account[symbol]['value']/total
        if pct < 0.95*avg_pct:
            e.Buy(symbol,prices[symbol],(avg_pct-pct)*total/prices[symbol])
        if pct > 1.05*avg_pct:
            e.Sell(symbol,prices[symbol],(pct-avg_pct)*total/prices[symbol])
    res_list.append([e.account[symbol]['value'] for symbol in symbols] + [e.account['USDT']['total']])
res = pd.DataFrame(data=res_list, columns=symbols+['total'],index = df.index)
[501]では:
e.account['USDT']
出場[501]:
[499]:
(res.total/10000).plot(figsize=(12,4),grid = True);
df[symbols].mean(axis=1).plot(figsize=(12,4),grid=True);
退場 [499]:
[503]では:
#Only the currency with the highest increase is tested
symbols = list(df.iloc[-1].sort_values()[-3:].index)
e = Exchange(symbols, fee=0.001, initial_balance=10000)
res_list = []
avg_pct = 1/len(symbols)
for row in df[symbols].iterrows():
    prices = row[1]
    total = e.account['USDT']['total']
    e.Update(prices)
    for symbol in symbols:
        pct = e.account[symbol]['value']/total
        if pct < 0.95*avg_pct:
            e.Buy(symbol,prices[symbol],(avg_pct-pct)*total/prices[symbol])
        if pct > 1.05*avg_pct:
            e.Sell(symbol,prices[symbol],(pct-avg_pct)*total/prices[symbol])
    res_list.append([e.account[symbol]['value'] for symbol in symbols] + [e.account['USDT']['total']])
res = pd.DataFrame(data=res_list, columns=symbols+['total'],index = df.index)
[504]:
e.account['USDT']
外出[504]:
[505]:
(res.total/10000).plot(figsize=(12,4),grid = True);
df[symbols].mean(axis=1).plot(figsize=(12,4),grid=True);
外出[505]:
概要
一般的に2021年は偽造貨幣の牛市であり,ビットコインの下落年となる.ビットコインの市場価値は,今年の初めの70%から現在40%に低下し,歴史上最低水準となっている.したがって,過去1年間で偽造品を購入し保有する平均利益は,ビットコイン保有する平均利益よりもはるかに高い.2022年を見据えて,2022年に現在市場にはまだ数百倍もの通貨が存在すると考えている場合は,ポジションを大胆に多様化し,忍耐強く待つことができます.いくつかの通貨または平均市場について特に楽観的であれば,考えずに過剰なリターンを得るために回転戦略を使用できます.物事が極端に逆転すると互いに到達すると考えれば,より良いリターンとセキュリティを得るためにビットコインを交渉狩りすることができます.
- 暗号通貨市場の基本分析を定量化する: データが自分で話せ!
- 通貨圏の基礎的な定量化研究 - 数字を客観的に話すために,あらゆる
教師を信頼しなくていい! - 量化取引の必須ツール - 発明者による量化データ探索モジュール
- すべてをマスターする - FMZの新バージョンの取引ターミナルへの紹介 (TRB仲裁ソースコード)
- FMZの新バージョンの取引端末のご紹介 (TRBの利息ソースコード追加)
- FMZ Quant: 仮想通貨市場における共通要件設計例の分析 (II)
- 80行のコードで高周波戦略で 脳のない販売ボットを利用する方法
- FMZ定量化:仮想通貨市場の常用需要設計事例解析 (II)
- 80行コードの高周波戦略で脳のないロボットを搾取して売る方法
- FMZ Quant: 仮想通貨市場における共通要件設計例の分析 (I)
- FMZ定量化:仮想通貨市場の常用需要設計事例解析 (1)