ニック・ライポック トレイリング・リバース (NRTR)
作者: リン・ハーンチャオチャン, 日時: 2022-05-25 18:14:32タグ:NRTR
この指標は2001年にコンスタンティン・コピルキンによって発明された. ニック・ライポック
コピルキン -> コピル・キン -> コピル・キン -> ニク・リポク
この指標の考え方は,チェンデリア・エグジットに似ているが,ATRコンポーネントを含まない.代わりにパーセントを使用する.
NRTRを計算するために動的価格チャネルが用いられる.計算には,現在のトレンドに含まれる価格のみが含まれており,以前のトレンドに関連する極端値を除外される.指標は,価格が到達した極端値 (現在の上昇傾向の最大峰以下,現在の下落傾向の最低底以上) から常に同じ距離 (パーセントで) に位置する.
バックテスト
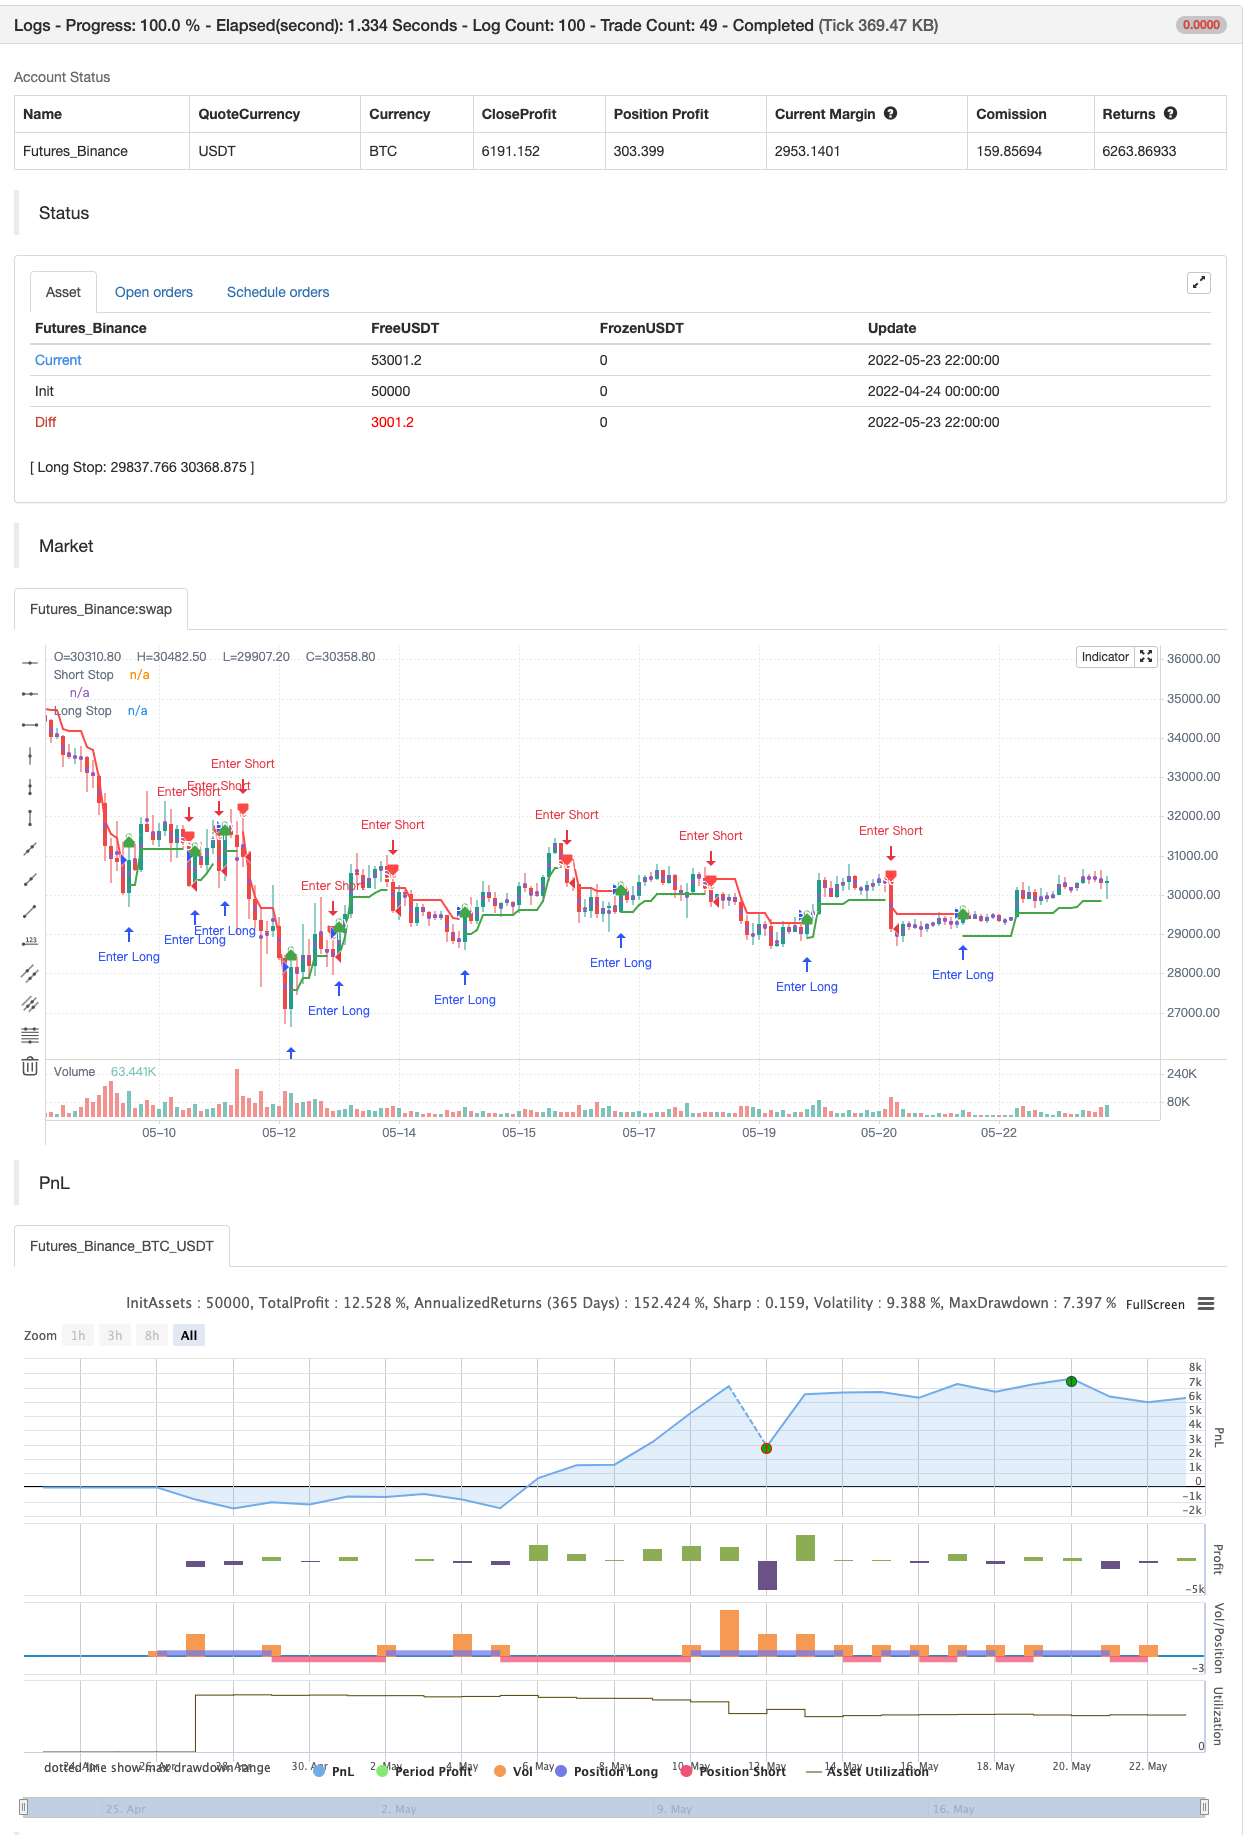
/*backtest
start: 2022-04-24 00:00:00
end: 2022-05-23 23:59:00
period: 2h
basePeriod: 15m
exchanges: [{"eid":"Futures_Binance","currency":"BTC_USDT"}]
*/

//@version=4
// Copyright (c) 2021-present, Alex Orekhov (everget)
study("Nick Rypock Trailing Reverse", shorttitle="NRTR", overlay=true)

k = input(title="Coefficient of Correction, %", type=input.float, minval=0, maxval=100, step=0.1, defval=2)
showLabels = input(title="Show Buy/Sell Labels ?", type=input.bool, defval=true)
applyRibbon = input(title="Apply Ribbon ?", type=input.bool, defval=true)

var int trend = 0
var float hp = close
var float lp = close
float nrtr = close

percentage = k * 0.01

if trend >= 0
	if close > hp
		hp := close
		hp
	nrtr := hp * (1 - percentage)
	if close <= nrtr
		trend := -1
		lp := close
		nrtr := lp * (1 + percentage)
		nrtr
else
	if close < lp
		lp := close
		lp
	nrtr := lp * (1 + percentage)
	if close > nrtr
		trend := 1
		hp := close
		nrtr := hp * (1 - percentage)
		nrtr

var color longColor = color.green
var color shortColor = color.red
var color textColor = color.white

longStopPlot = plot(trend == 1 ? nrtr : na, title="Long Stop", style=plot.style_linebr, linewidth=2, color=longColor)
buySignal = trend == 1 and trend[1] == -1
plotshape(buySignal ? nrtr : na, title="Long Stop Start", location=location.absolute, style=shape.circle, size=size.tiny, color=longColor, transp=0)
plotshape(buySignal and showLabels ? nrtr : na, title="Buy Label", text="Buy", location=location.absolute, style=shape.labelup, size=size.tiny, color=longColor, textcolor=textColor, transp=0)

shortStopPlot = plot(trend == 1 ? na : nrtr, title="Short Stop", style=plot.style_linebr, linewidth=2, color=shortColor)
sellSignal = trend == -1 and trend[1] == 1
plotshape(sellSignal ? nrtr : na, title="Short Stop Start", location=location.absolute, style=shape.circle, size=size.tiny, color=shortColor, transp=0)
plotshape(sellSignal and showLabels ? nrtr : na, title="Sell Label", text="Sell", location=location.absolute, style=shape.labeldown, size=size.tiny, color=shortColor, textcolor=textColor, transp=0)

midPricePlot = plot(ohlc4, title="", style=plot.style_circles, linewidth=0, display=display.none, editable=false)

longFillColor = applyRibbon ? (trend == 1 ? longColor : na) : na
shortFillColor = applyRibbon ? (trend == -1 ? shortColor : na) : na
fill(midPricePlot, longStopPlot, title="Long Ribbon", color=longFillColor)
fill(midPricePlot, shortStopPlot, title="Short Ribbon", color=shortFillColor)

changeCond = trend != trend[1]
alertcondition(changeCond, title="Alert: NRTR Direction Change", message="NRTR has changed direction!")
alertcondition(buySignal, title="Alert: NRTR Buy", message="NRTR Buy!")
alertcondition(sellSignal, title="Alert: NRTR Sell", message="NRTR Sell!")


if buySignal
    strategy.entry("Enter Long", strategy.long)
else if sellSignal
    strategy.entry("Enter Short", strategy.short)
関連性
もっと
- Scalping EMA ADX RSI 購入/売却
- 量差
- スーパー・トレンド・デイリー 2.0 BF
- ハルフ移動平均スイングトレーダー
- FTSMA - トレンドはあなたのフレンドです
- 範囲フィルター 購入・販売
- SSLチャネル
- ハル・スイート戦略
- パラボリック SAR 買って売る
- ピボットベース トレイリング マキシマ・ミニマ
- ジグザグPA戦略 V4.1
- 日中の買い/売る
- 壊れたフラクタル: 誰かの壊れた夢はあなたの利益です!
- 利益の最大化 PMax
- 完璧 な 勝利 の 戦略
- ストカスティック+RSI,ダブル戦略
- スウィング・ハル/RSI/EMA戦略
- Scalping Swing Trading ツール R1-4
- 最良の飲み込み+脱出戦略
- Bollinger Awesome アラート R1