適応的ボラティリティに基づく有限体積要素戦略

1
Follow
1781
Followers
概要
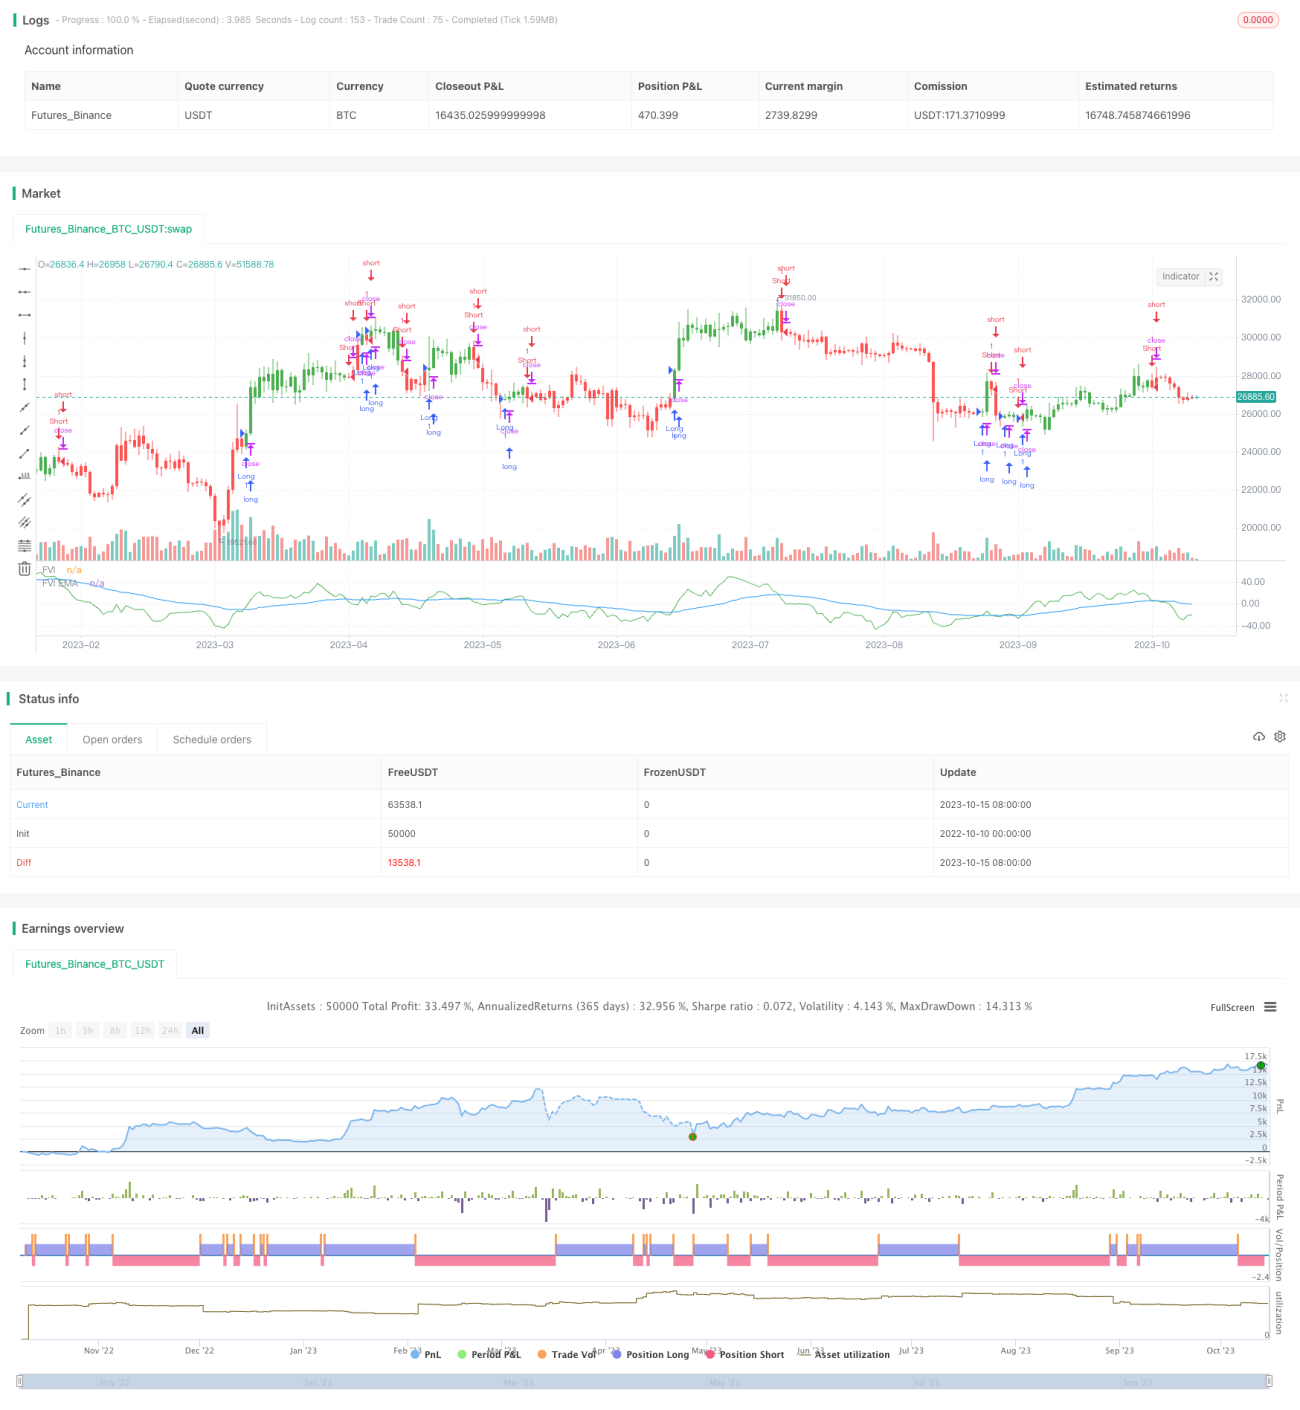
この戦略は,限られた体積要素の方法を使用し,自適應波動性の測定と組み合わせて,価格変化の多空判断を行う.これは,トレンド追跡型の戦略である.この戦略は,各時間周期に適用され,異なる波動性のレベルに対応してパラメータを自動的に調整することができる.
原則
策略は,先のN根K線の高低平均値,閉店価格平均値,および前K線の高低閉店価格平均値を計算する. そして,現在のK線と前K線の対数リターン率のIntraとInterを計算する. 同時に,IntraとInterの変動性VintraとVinterを計算する.
変動レベルと可調パラメータに基づいて,自適性切断係数CutOffを計算する.価格の変化がCutOffを超えると多空信号を与える.具体的には,現在のK線閉盘価格と高低平均価格の差値MFを計算する.MFがCutOffより大きいときは多頭信号,MFがマイナスである場合のCutOffは空頭信号である.
最後に,シグナルによる資金流向を計算し,シグナル pos を出力し,限定体積要素曲線 FVE を描画する.
利点
- 適応パラメータは,異なる周期と変動レベルに適用され,人為調整を必要としません.
- 価格の動向の変化を正確に捉える
- 有限体積要素曲線は多空力対比を明確に反映している.
- 資金流動の理論的基盤は安定し,信号はより信頼性が高い.
リスク
- 市場が激しく揺れるとき,誤信号がより多く発生する可能性があります. Nパラメータを適切に調整できます.
- 価格の飛躍を処理できない.他の指標を組み合わせて補足することを考えることができます.
- 資金流動理論と技術分析の信号に偏差がある可能性がある.複数の信号の総合判断を考慮することができる.
最適化の方向
- 異なるNのパラメータが結果に影響を及ぼすことをテストすることができる.一般的にはNが大きい値を取って,過剰なノイズをフィルターすることができる.
- Cintra と Cinter の異なる取値をテストして,最適なパラメータの組み合わせを見つけることができる。また,この2つのパラメータを動的に調整することも考えることができる。
- 戦略の安定性を高めるために,MACDなどの他の指標と組み合わせることも考えられます.
- 単一損失を抑えるための ストップダメージメカニズムを 構築できます
要約する
この戦略は,全体的に比較して信頼性があり,原理が優れ,トレンド追跡戦略の構成要素として用いられ,他の戦略と適切に組み合わせた後,効果がより良くなります.鍵は,最適なパラメータを見つけ,良き風制御措置を確立することです.後期に引き続き最適化できれば,非常に強力なトレンド追跡戦略になります.
Source
Pine
/*backtest
start: 2022-10-10 00:00:00
end: 2023-10-16 00:00:00
period: 1d
basePeriod: 1h
exchanges: [{"eid":"Futures_Binance","currency":"BTC_USDT"}]
*/

//@version=2
////////////////////////////////////////////////////////////
//  Copyright by HPotter v1.0 18/08/2017
// This is another version of FVE indicator that we have posted earlier Strategy parameters
Related strategies
Comment
All comments (0)
No data
- 1