トレンドを捉える戦略

MA SMA
作成日: 2024-04-26 11:48:28 最終変更日: 2024-04-26 11:48:28
コピー: 5 クリック数: 753
1
フォロー
1617
フォロワー

トレンドを捉える戦略

概要

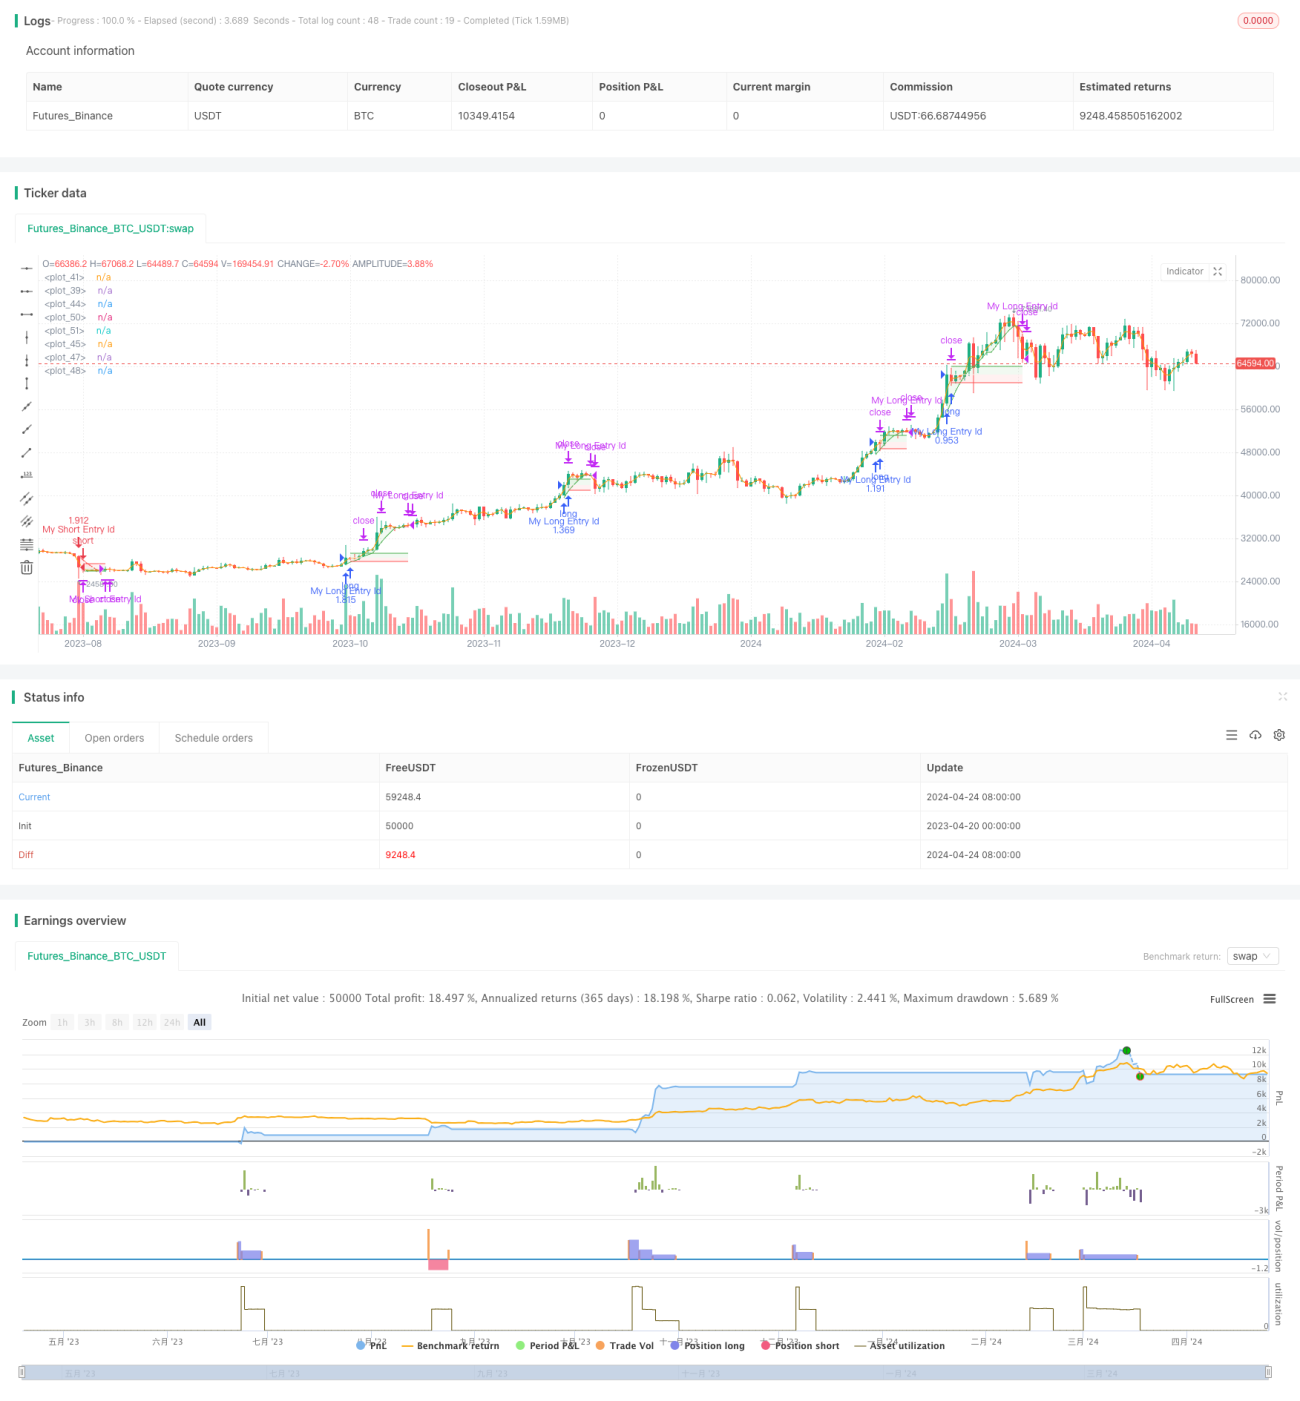
トレンドキャプチャ戦略は,特異的な方法を使用してトレンドの形成を検出し,トレンドの方向にポジションを開く戦略である.それは,特定の範囲内の最高価格と最低価格の差を,その範囲内のすべてのK線長さの合計と比算することによって,“限界”と呼ばれるパーセント値を得ます.その値が100に近づくほど,トレンドが強いことを示す.その値が設定された限界を超え,移動平均線が上向きになると,戦略は多項開きます.

戦略原則

  1. 特定の範囲の最高値と最低値の差値と,その範囲のすべてのK線長さの和を計算する.
  2. 差値をK線長さの和で割って100で掛けると”限度”と呼ばれるパーセント値が得られます.
  3. 制限が設定値を超え,移動平均が上向きに移動すると,多項を打つ.制限が設定値を超え,移動平均が下向きに移動すると,空項を打つ.
  4. ポジション開設後,価格がストップポイントに達すると,部分的なポジションを平らげ,残りのポジションはストップポイントに移動する.
  5. 移動平均線が下を横切るときは,多枚を平らにする.移動平均線が上を横切るときは,空枚を平らにする.

戦略的優位性

  1. 戦略は,トレンド形成を検出する独自の方法を使用し,トレンドの強さを制限値を計算することによって判断し,トレンドの初期にポジションを開くのに役立ちます.
  2. 策略 ポジション開設後,部分的なポジションを平らげ,残ったポジションのストップ・ロスを移動することでリスクをコントロールする.
  3. 戦略は,移動平均の上昇と下落を介してトレンドの終わりを判断し,適切なタイミングでポジションをクリアするのに役立ちます.

戦略リスク

  1. トレンドの初期にポジションを入れると,トレンドが継続できない場合,損失を招く可能性があります.
  2. 戦略は固定ストップとストップ・ロスを使用し,場合によっては柔軟性がない場合もあります.
  3. この戦略は,移動平均のみを用いてトレンドを判断し,トレンドの機会を逃してしまう可能性があります.

戦略最適化の方向性

  1. ポジション開設の正確性を高めるために,MACD,RSIなどの他の指標をトレンド判断に活用することも考えられます.
  2. 市場変動に応じてストップとストップ・ローズを動的に調整して,リスクをより良くコントロールできます.
  3. トレンドが確認された後,トレンドの初期にリスクを軽減するために,トレンドの確認後にポジションを開くことも考えられます.

要約する

トレンドキャプチャ戦略は,トレンドの形成を検出し,トレンドの方向にポジションを開くためのユニークな方法を使用する. それは,限界値を計算してトレンドの強さを判断し,移動平均の横断を介してトレンドの終了を判断する. 戦略は,ポジションを開いた後に,部分的なポジションを平らめ,移動ストップ・ロスの位置を移動することによってリスクを制御する. しかし,戦略は,トレンドの初期にポジションを開くことは,一定のリスクに直面する可能性があります. 固定ストップ・ロスの位置を用いることは,柔軟性が不足し,移動平均線のみでトレンドを判断する方法は,いくつかの機会を逃す可能性があります.

ストラテジーソースコード
/*backtest
start: 2023-04-20 00:00:00
end: 2024-04-25 00:00:00
period: 1d
basePeriod: 1h
exchanges: [{"eid":"Futures_Binance","currency":"BTC_USDT"}]
*/

// This source code is subject to the terms of the Mozilla Public License 2.0 at https://mozilla.org/MPL/2.0/
// © faytterro

//@version=5
strategy("Trend Catcher Strategy", overlay=true, default_qty_type = strategy.percent_of_equity, default_qty_value = 100)
len = input.int(10)
tp = input.float(2.5, step = 0.1)
sl = input.float(2.5, step = 0.1)
malen = input.int(5)
limit = input.int(50)
ma = ta.sma(close,malen)
sum = 0.0
for i = 0 to len-1
    sum := sum + high[i]-low[i]
frs = 100*(ta.highest(high,len)-ta.lowest(low,len))/sum
//hline(50)
//plot(frs, color = color.white)
l = ta.crossover(frs,limit) and ma>ma[1]
s = ta.crossover(frs,limit) and ma<ma[1]
cl = ma<ma[1]
cs = ma>ma[1]
qty_balance=input.int(50, maxval = 100)
if (l)
    strategy.entry("My Long Entry Id", strategy.long)
    strategy.exit("exit long", "My Long Entry Id", qty_percent = qty_balance, limit = close*(100+tp)/100, stop = close*(100-sl)/100)

if (s)
    strategy.entry("My Short Entry Id", strategy.short)
    strategy.exit("exit short", "My Short Entry Id", qty_percent = qty_balance, limit = close*(100-tp)/100, stop = close*(100+sl)/100)

if (cl)
    strategy.close("My Long Entry Id")
if (cs)
    strategy.close("My Short Entry Id")

l:= l and strategy.opentrades<1
s:= s and strategy.opentrades<1
transp = strategy.opentrades>0? 0 : 100
pma=plot(ma, color = ma<ma[1]? color.rgb(255, 82, 82, transp) : color.rgb(76, 175, 79, transp))
price = open/2+close/2
pprice = plot(price, display = display.none)
fill(pma,pprice, color = ma<ma[1]? color.rgb(255, 82, 82, transp+90) : color.rgb(76, 175, 79, transp+90))

spm=plot(ta.valuewhen(s,close,0), color = (strategy.opentrades>0 and ma<ma[1] and ma[1]<ma[2])? color.white : color.rgb(1,1,1,100), offset=1)
lpm=plot(ta.valuewhen(l,close,0), color = (strategy.opentrades>0 and ma>ma[1] and ma[1]>ma[2])? color.white : color.rgb(1,1,1,100), offset=1)

ltp=plot(ta.valuewhen(l,close,0)*(100+ta.valuewhen(l,tp,0))/100,  color = (strategy.opentrades>0 and ma>ma[1] and ma[1]>ma[2])? color.green : color.rgb(1,1,1,100), offset=1)
lsl=plot(ta.valuewhen(l,close,0)*(100-ta.valuewhen(l,sl,0))/100,  color = (strategy.opentrades>0 and ma>ma[1] and ma[1]>ma[2])? color.red : color.rgb(1,1,1,100), offset=1)

stp=plot(ta.valuewhen(s,close,0)*(100-ta.valuewhen(s,tp,0))/100, color = (strategy.opentrades>0 and ma<ma[1] and ma[1]<ma[2])? color.green : color.rgb(1,1,1,100), offset=1)
ssl=plot(ta.valuewhen(s,close,0)*(100+ta.valuewhen(s,sl,0))/100, color = (strategy.opentrades>0 and ma<ma[1] and ma[1]<ma[2])? color.red : color.rgb(1,1,1,100), offset=1)
fill(stp,spm, color = (strategy.opentrades>0 and ma<ma[1] and ma[1]<ma[2])? color.rgb(76, 175, 79, 90) : color.rgb(1,1,1,100))
fill(ssl,spm, color = (strategy.opentrades>0 and ma<ma[1] and ma[1]<ma[2])? color.rgb(255, 82, 82, 90) : color.rgb(1,1,1,100))
fill(ltp,lpm, color = (strategy.opentrades>0 and ma>ma[1] and ma[1]>ma[2])? color.rgb(76, 175, 79, 90) : color.rgb(1,1,1,100))
fill(lsl,lpm, color = (strategy.opentrades>0 and ma>ma[1] and ma[1]>ma[2])? color.rgb(255, 82, 82, 90) : color.rgb(1,1,1,100))