移動平均クロスオーバー多層利益戦略

1
Follow
1785
Followers
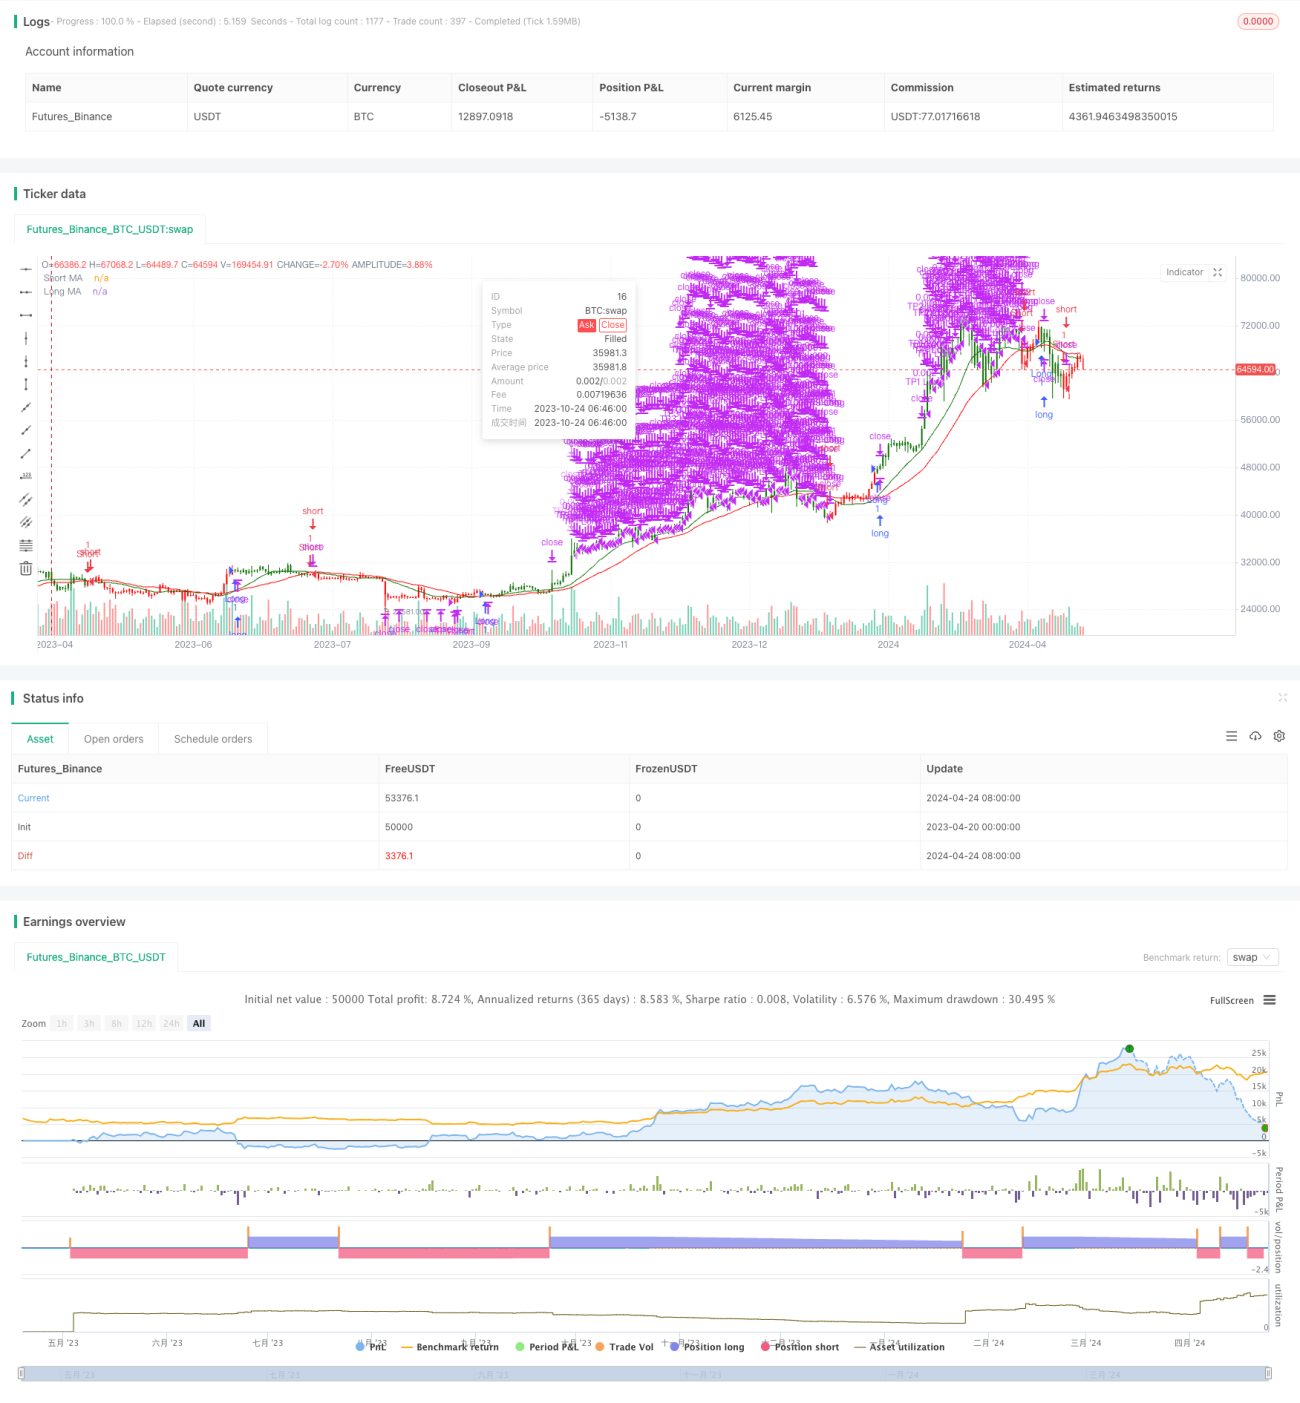
概要
この戦略は,2つの移動平均線の交差を利用して市場動向を判断し,短期移動平均線に長期移動平均線を穿越したときに多ポジションを開き,逆に空いている.同時に,この戦略は,価格が想定された利益レベルに達したときに,分量的にポジションを平らにして,それによって利益を最大化し,リスクをコントロールする.
戦略原則
この戦略の核心は,異なる周期の移動平均を利用して市場トレンドを捉えることである.短期移動平均の上部に長期移動平均を穿越すると,市場は上昇傾向に突入する可能性があることを意味し,このとき多ポジションを開く.短期移動平均の下部に長期移動平均を穿越すると,市場は下部傾向に突入する可能性があることを意味し,このとき空白ポジションを開く.同時に,この戦略は,複数の利益のレベルを設定し,価格がこれらのレベルに達すると,預定されたポジションの比率で平衡状態に置く.
戦略的優位性
- シンプルで効果的:この戦略は古典的な移動平均の交差原理に基づいています. シンプルで分かりやすいですが,実務で有効であることが証明されています.
- 多層の利益結束:複数の利益レベルを設定し,価格がそれらのレベルに達すると,大量に平仓することで,利益を最大化し,同時にリスクを制御することができます.
- パラメータの柔軟性:この戦略のパラメータ設定は非常に柔軟であり,ユーザーは自分のニーズと市場の特徴に応じて,移動平均周期と利益のレベルを最適化することができます.
戦略リスク
- 市場波動のリスク:市場が激しく波動する時には,頻繁に交差するシグナルが戦略の頻繁な取引に繋がり,取引コストと撤回リスクを増加させる.
- パラメータ設定リスク:不適切なパラメータ設定は,移動平均周期の不適切な選択,または利益レベルの不合理な設定など,戦略の不良パフォーマンスを引き起こす可能性があります.
- トレンド認識リスク:この戦略は主にトレンドに依存し,波動的な市場やトレンドが不明なときに,偽信号が多く現れ,損失を引き起こす可能性があります.
戦略最適化の方向性
- 他の指標と組み合わせる: RSI,MACDなどの他の技術的指標と組み合わせることを検討して,トレンドの認識の正確性と信頼性を向上させることができます.
- 最適化パラメータ:異なる市場状況に対応するために,回帰と最適化により,最適な移動平均周期と収益レベルパラメータを見つけることができます.
- ストップを追加する: ATR 設定によるダイナミックストップなど,リスクをさらに制御するためにストップメカニズムを追加することを考慮することができます.
- エントリーとエントリーの変更: 戦略の安定性を高めるために,取引量,サポートレジスタンスなどの要因を考慮して,より多くのエントリーとエントリーの条件を探索できます.
要約する
移動平均線交差多層利得戦略は,多層利得結束の方法によって,トレンドの中でより多くの利得を得ることができ,リスクをコントロールする簡単な効果的なトレンド追跡戦略である.しかし,この戦略には,特定の市場状況とユーザーのニーズに応じて最適化および改善を必要とするいくつかの制限とリスクがあります.全体的に,この戦略は,有効な取引ツールとして使用できますが,完全に依存することはできません.
Source
Pine
/*backtest
start: 2023-04-20 00:00:00
end: 2024-04-25 00:00:00
period: 1d
basePeriod: 1h
exchanges: [{"eid":"Futures_Binance","currency":"BTC_USDT"}]
*/

// This Pine Script™ code is subject to the terms of the Mozilla Public License 2.0 at https://mozilla.org/MPL/2.0/
// © ValdesTradingBots

//Follow Us for More Insights and Updates!Strategy parameters
Related strategies
Comment
All comments (0)
No data
- 1