2021 년 디지털 통화 시장 검토 및 가장 간단한 10 번 전략 놓쳤다
저자:리디아, 창작: 2022-10-26 16:12:49, 업데이트: 2023-09-15 20:41:17
2021년 요약 및 미래 전략
2021년은 끝나고 있고, DEFI에서 GAMEFI에 이르는 핫스팟이 끝없는 흐름으로 등장하고 있으며, 전체 시장은 여전히 황소 시장입니다. 이제 돌아보고 요약해보세요. 2021년에 얼마나 많은 이익을 얻었습니까? 어떤 기회를 놓쳤습니까? 어떤 성공적인 투자가 있었습니까? 최근, 나는 지난 해의 역사적인 시장을 살펴보고 예상치 못한 간단한 수익 전략, 즉 다화폐 지수를 발견했습니다.
거래소에는 너무 많은 화폐가 있으며, 그 중 많은 것이 알려지지 않을 운명이며 거래에서 철수 할 수도 있습니다. 여기 우리는 시장에서 사용 된 바이낸스 영구 계약의 화폐를 선택합니다. 일반적으로 테스트되고 비교적 안전한 주류 화폐로 인정됩니다. 간단한 스크린 후에 일부 지표 화폐가 제거되어 134 개의 화폐가 최종적으로 얻었습니다.
[1]에서:
import requests
from datetime import date,datetime
import time
import pandas as pd
import numpy as np
import matplotlib.pyplot as plt
%matplotlib inline
[144]에서:
## Current trading pairs
Info = requests.get('https://fapi.binance.com/fapi/v1/exchangeInfo')
symbols = [s['symbol'] for s in Info.json()['symbols']]
[154]:
symbols_f = list(set(filter(lambda x: x[-4:] == 'USDT', [s.split('_')[0] for s in symbols]))-
                 set(['1000SHIBUSDT','1000XECUSDT','BTCDOMUSDT','DEFIUSDT','BTCSTUSDT'])) + ['SHIBUSDT','XECUSDT']
print(symbols_f)
[155]에서:
print(len(symbols_f))
지난 해 시장
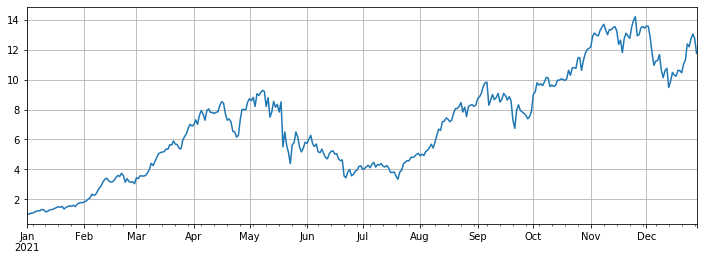
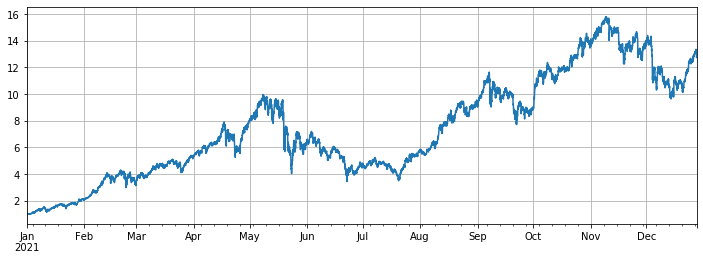
그 다음 우리는 지난 해의 일일 폐쇄 가격을 얻습니다. 일부 화폐가 짧은 기간 동안 선반에 있었으므로 데이터를 채워야합니다. 인덱스는 데이터를 정상화하여 계산 할 수 있습니다.
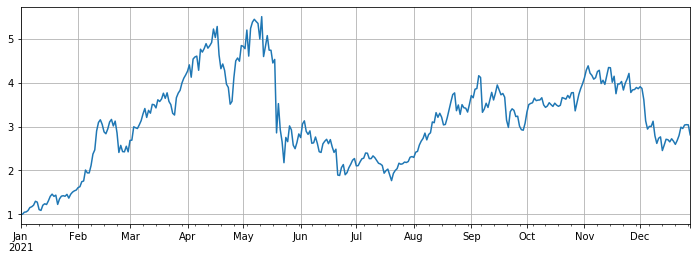
최종 지수 수익률은 약 12배, 즉 2021년 1월 1일에 134개의 코인을 평균적으로 구매하면 아무것도 하지 않는 최종 수익률은 12배에 달한다. 거래자의 90% 이상이 평균 지수를 능가하지 않는다고 추정된다. 그 중 가장 큰 하락률을 보이는 화폐는: ICP가 93%, DODO가 85%, LINA가 75% 떨어졌다. SOL, FTM, LUNA, MATIC, SAND, AXS가 거의 100배 증가한 반면. 그 중 AXS가 168배 상승하여 가장 큰 암흑마가 되었다. 중산은 3배 증가했으며, 이는 주로 공공 체인 및 게임으로 인해 발생했다. 생존 편향을 방지하기 위해, 우리는 기간 동안 영구적인 새로운 화폐를 배제했으며, 또한 수익의 거의 11배를 달성했다. 그것은 BTC의 7배입니다.
이것은 절망적인 수익률입니다. 나는 모든 종류의 전략을 만들기 위해 열심히 일했지만 1 년 동안 아무것도하지 않는 수익과는 거리가 멀었습니다. 그러나 특정 증가 중 일부가 너무 커지고 지표에서 벗어났다는 점에 유의해야합니다. 이 통화들이 1 년 초에 선택되지 않으면 수익은 매개값에 가깝게 될 것입니다. 이 수익은 훨씬 덜 수익적입니다.
[157]에서:
#Obtain the function of K-line in any period
def GetKlines(symbol='BTCUSDT',start='2020-8-10',end='2021-8-10',period='1h',base='fapi',v = 'v1'):
    Klines = []
    start_time = int(time.mktime(datetime.strptime(start, "%Y-%m-%d").timetuple()))*1000 + 8*60*60*1000
    end_time = int(time.mktime(datetime.strptime(end, "%Y-%m-%d").timetuple()))*1000 + 8*60*60*1000
    intervel_map = {'m':60*1000,'h':60*60*1000,'d':24*60*60*1000}
    while start_time < end_time:
        mid_time = min(start_time+1000*int(period[:-1])*intervel_map[period[-1]],end_time)
        url = 'https://'+base+'.binance.com/'+base+'/'+v+'/klines?symbol=%s&interval=%s&startTime=%s&endTime=%s&limit=1000'%(symbol,period,start_time,mid_time)
        res = requests.get(url)
        res_list = res.json()
        if type(res_list) == list and len(res_list) > 0:
            start_time = res_list[-1][0]
            Klines += res_list
        elif type(res_list) == list:
            start_time = start_time+1000*int(period[:-1])*intervel_map[period[-1]]
        else:
            break

    df = pd.DataFrame(Klines,columns=['time','open','high','low','close','amount','end_time','volume','count','buy_amount','buy_volume','null']).astype('float')
    df.index = pd.to_datetime(df.time,unit='ms')
    return df
[164]에서:
df_all_s = pd.DataFrame(index=pd.date_range(start='2021-1-1', end='2021-12-28', freq='1d'),columns=symbols_s)
for i in range(len(symbols_f)):
    #print(symbols_s[i])
    symbol_s = symbols_f[i]
    df_s = GetKlines(symbol=symbol_s,start='2021-1-1',end='2021-12-28',period='1d',base='api',v='v3')
    df_all_s[symbol_s] = df_s[~df_s.index.duplicated(keep='first')].close
[165]에서:
df_all_s.tail() #data structure
외출 [1]:
[174]에서:
df_all = df_all_s.fillna(method='bfill')#filled data
df_norm = df_all/df_all.iloc[0] #normalization
df_norm.mean(axis=1).plot(figsize=(12,4),grid=True);
#The final index return chart
외출 [1]:
[175]에서:
#The median increase
df_norm.median(axis=1).plot(figsize=(12,4),grid=True);
외출 [1]:
[168]에서:
#Ranking for increase/decrease
print(df_norm.iloc[-1].round(2).sort_values().to_dict())
[317]에서:
#Maximum rollback of current price compared with the highest point in the year
print((1-df_norm.iloc[-1]/df_norm.max()).round(2).sort_values().to_dict())
[177]에서:
df_all_f = pd.DataFrame(index=pd.date_range(start='2021-1-1', end='2021-12-28', freq='1d'),columns=symbols_s)
for i in range(len(symbols_f)):
    #print(symbols_s[i])
    symbol_f = symbols_f[i]
    df_f = GetKlines(symbol=symbol_f,start='2021-1-1',end='2021-12-28',period='1d',base='fapi',v='v1')
    df_all_f[symbol_f] = df_f[~df_f.index.duplicated(keep='first')].close
[208]에서:
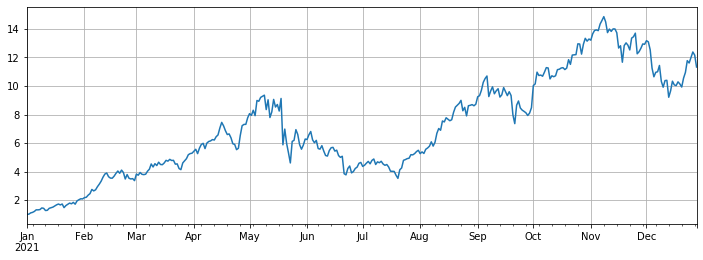
#Excluding new currency
df = df_all_s[df_all_s.columns[~df_all_f.iloc[0].isnull()]]
df = df.fillna(method='bfill')
df = df/df.iloc[0]
df.mean(axis=1).plot(figsize=(12,4),grid=True);
외출 [1]:
[212]에서:
#Compared with Bitcoin
(df.mean(axis=1)/df.BTCUSDT).plot(figsize=(12,4),grid=True);
외출 [1]:
[213]에서:
#Use the original backtest engine
class Exchange:

    def __init__(self, trade_symbols, fee=0.0004, initial_balance=10000):
        self.initial_balance = initial_balance #Initial assets
        self.fee = fee
        self.trade_symbols = trade_symbols
        self.account = {'USDT':{'realised_profit':0, 'unrealised_profit':0, 'total':initial_balance, 'fee':0}}
        for symbol in trade_symbols:
            self.account[symbol] = {'amount':0, 'hold_price':0, 'value':0, 'price':0, 'realised_profit':0,'unrealised_profit':0,'fee':0}

    def Trade(self, symbol, direction, price, amount):

        cover_amount = 0 if direction*self.account[symbol]['amount'] >=0 else min(abs(self.account[symbol]['amount']), amount)
        open_amount = amount - cover_amount
        self.account['USDT']['realised_profit'] -= price*amount*self.fee #Deduct the handling fee
        self.account['USDT']['fee'] += price*amount*self.fee
        self.account[symbol]['fee'] += price*amount*self.fee

        if cover_amount > 0: #Close the position first
            self.account['USDT']['realised_profit'] += -direction*(price - self.account[symbol]['hold_price'])*cover_amount  #Profits
            self.account[symbol]['realised_profit'] += -direction*(price - self.account[symbol]['hold_price'])*cover_amount

            self.account[symbol]['amount'] -= -direction*cover_amount
            self.account[symbol]['hold_price'] = 0 if self.account[symbol]['amount'] == 0 else self.account[symbol]['hold_price']

        if open_amount > 0:
            total_cost = self.account[symbol]['hold_price']*direction*self.account[symbol]['amount'] + price*open_amount
            total_amount = direction*self.account[symbol]['amount']+open_amount

            self.account[symbol]['hold_price'] = total_cost/total_amount
            self.account[symbol]['amount'] += direction*open_amount


    def Buy(self, symbol, price, amount):
        self.Trade(symbol, 1, price, amount)

    def Sell(self, symbol, price, amount):
        self.Trade(symbol, -1, price, amount)

    def Update(self, close_price): #Update the assets
        self.account['USDT']['unrealised_profit'] = 0
        for symbol in self.trade_symbols:
            self.account[symbol]['unrealised_profit'] = (close_price[symbol] - self.account[symbol]['hold_price'])*self.account[symbol]['amount']
            self.account[symbol]['price'] = close_price[symbol]
            self.account[symbol]['value'] = abs(self.account[symbol]['amount'])*close_price[symbol]
            self.account['USDT']['unrealised_profit'] += self.account[symbol]['unrealised_profit']
        self.account['USDT']['total'] = round(self.account['USDT']['realised_profit'] + self.initial_balance + self.account['USDT']['unrealised_profit'],6)
[418]에서:
#The hourly K-line was taken to make the backtest more accurate
df_all_s = pd.DataFrame(index=pd.date_range(start='2021-1-1', end='2021-12-28', freq='1h'),columns=symbols_s)
for i in range(len(symbols_f)):
    #print(symbols_s[i])
    symbol_s = symbols_f[i]
    df_s = GetKlines(symbol=symbol_s,start='2021-1-1',end='2021-12-28',period='1h',base='api',v='v3')
    df_all_s[symbol_s] = df_s[~df_s.index.duplicated(keep='first')].close
[419]에서:
df = df_all_s[df_all_s.columns[~df_all_f.iloc[0].isnull()]]
df = df.fillna(method='bfill')
df = df/df.iloc[0]
df.mean(axis=1).plot(figsize=(12,4),grid=True);
아웃[419]:
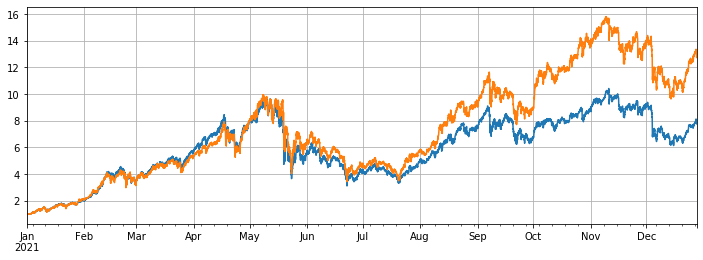
균형 잡힌 전략의 성과
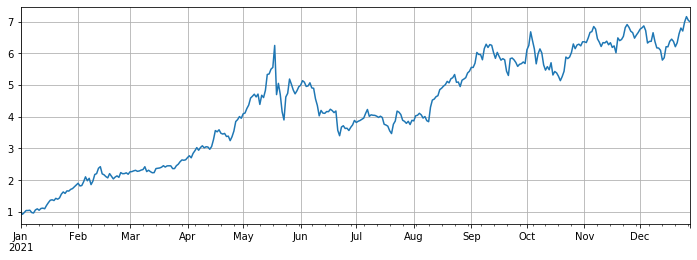
백테스트에서 2021년 1월 1일 온라인 바이낸스 영구계약의 모든 통화가 선택되었다. K-라인 기간은 1h였다. 매개 변수는 지위가 평균보다 5% 낮을 때 지위를 확장하기 시작했고, 지위가 5% 이상일 때 판매했다. 백테스트가 모든 통화를 포함하면 최종 전략 수익률은 7.7배이다. 분명히 13배의 평균 수익률만큼 좋지 않다. 이것은 또한 예상된다. 결국, 100배 상승한 여러 통화는 너무 특별하며, 균형 전략은 모두를 판매할 것이다.
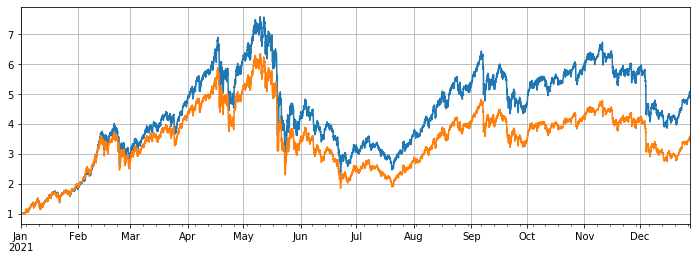
가장 높은 상승률을 가진 10개 통화가 백테스트에서 제거되면 상대적으로 평균적인 통화가만 고려되며 최종 수익은 평균 3.4배를 훨씬 뛰어넘는 4.8배가 될 것입니다.
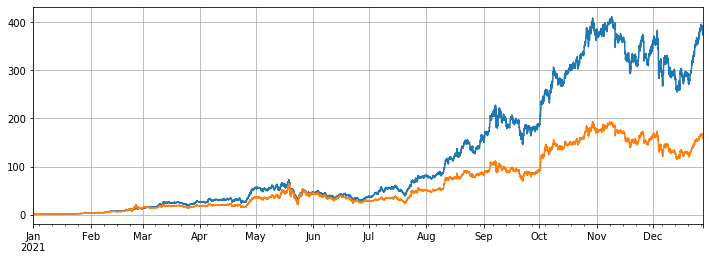
가장 높은 상승률을 가진 3개의 통화만 회전되면 최종 이익은 373배가 될 것이고, 이는 평균 160배의 성과보다 훨씬 높습니다. 이것은 선택된 회전 통화의 추세와 증가가 일관성있는 경향이있는 경우 회전 된 결과는 아무것도하지 않는 것보다 훨씬 낫다는 것을 보여줍니다.
[494]에서:
#Full currency backtest
symbols = list(df.iloc[-1].sort_values()[:].index)
e = Exchange(symbols, fee=0.001, initial_balance=10000)
res_list = []
avg_pct = 1/len(symbols)
for row in df[symbols].iterrows():
    prices = row[1]
    total = e.account['USDT']['total']
    e.Update(prices)
    for symbol in symbols:
        pct = e.account[symbol]['value']/total
        if pct < 0.95*avg_pct:
            e.Buy(symbol,prices[symbol],(avg_pct-pct)*total/prices[symbol])
        if pct > 1.05*avg_pct:
            e.Sell(symbol,prices[symbol],(pct-avg_pct)*total/prices[symbol])
    res_list.append([e.account[symbol]['value'] for symbol in symbols] + [e.account['USDT']['total']])
res = pd.DataFrame(data=res_list, columns=symbols+['total'],index = df.index)
[495]에서:
e.account['USDT']
아웃[495]:
[496]에서:
# Backtest performance of full currencies
(res.total/10000).plot(figsize=(12,4),grid = True);
df[symbols].mean(axis=1).plot(figsize=(12,4),grid=True);
외출[496]:
[498]에서:
#Remove currencies with huge growth
symbols = list(df.iloc[-1].sort_values()[:-10].index)
e = Exchange(symbols, fee=0.001, initial_balance=10000)
res_list = []
avg_pct = 1/len(symbols)
for row in df[symbols].iterrows():
    prices = row[1]
    total = e.account['USDT']['total']
    e.Update(prices)
    for symbol in symbols:
        pct = e.account[symbol]['value']/total
        if pct < 0.95*avg_pct:
            e.Buy(symbol,prices[symbol],(avg_pct-pct)*total/prices[symbol])
        if pct > 1.05*avg_pct:
            e.Sell(symbol,prices[symbol],(pct-avg_pct)*total/prices[symbol])
    res_list.append([e.account[symbol]['value'] for symbol in symbols] + [e.account['USDT']['total']])
res = pd.DataFrame(data=res_list, columns=symbols+['total'],index = df.index)
[501]에서:
e.account['USDT']
외출 [1]:
[499]에서:
(res.total/10000).plot(figsize=(12,4),grid = True);
df[symbols].mean(axis=1).plot(figsize=(12,4),grid=True);
아웃[499]:
[503]에서:
#Only the currency with the highest increase is tested
symbols = list(df.iloc[-1].sort_values()[-3:].index)
e = Exchange(symbols, fee=0.001, initial_balance=10000)
res_list = []
avg_pct = 1/len(symbols)
for row in df[symbols].iterrows():
    prices = row[1]
    total = e.account['USDT']['total']
    e.Update(prices)
    for symbol in symbols:
        pct = e.account[symbol]['value']/total
        if pct < 0.95*avg_pct:
            e.Buy(symbol,prices[symbol],(avg_pct-pct)*total/prices[symbol])
        if pct > 1.05*avg_pct:
            e.Sell(symbol,prices[symbol],(pct-avg_pct)*total/prices[symbol])
    res_list.append([e.account[symbol]['value'] for symbol in symbols] + [e.account['USDT']['total']])
res = pd.DataFrame(data=res_list, columns=symbols+['total'],index = df.index)
[504]에서:
e.account['USDT']
외출 [1]:
[505]에서:
(res.total/10000).plot(figsize=(12,4),grid = True);
df[symbols].mean(axis=1).plot(figsize=(12,4),grid=True);
외출[505]:
요약
일반적으로 2021년은 위조화폐의 황금시장과 비트코인의 하락년이다. 비트코인의 시장 가치는 올해 초 70%에서 40%로 하락했으며 이는 역사상 가장 낮은 수준이다. 따라서 지난 1년 동안 위조 상품을 구매하고 보유한 평균 이익은 비트코인을 보유한 평균 이익보다 훨씬 높다. 2022년을 앞두고 현재 시장에 여전히 수백 배의 통화들이 있을 것이라고 생각한다면, 당당하게 포지션을 다변화하고 인내심을 갖고 기다릴 수 있다. 몇 개의 통화나 평균 시장에 대해 특히 낙관적이라면, 생각없이 과도한 수익을 얻기 위해 회전 전략을 사용할 수 있다. 상황이 극단적으로 변할 때 서로가 서로에 맞게 될 것이라고 생각한다면, 더 나은 수익과 안전을 얻기 위해 비트코인을 협상 사냥할 수 있다.
- 암호화폐 시장의 근본 분석을 정량화: 데이터를 스스로 이야기하도록!
- 동전圈의 기초적인 양적 연구 - 더 이상 모든
선생님들을 믿지 말고, 데이터를 객관적으로 이야기하십시오! - 양적 거래의 필수 도구 - 발명자 양적 데이터 탐색 모듈
- 모든 것을 마스터 - FMZ에 대한 소개 트레이딩 터미널의 새로운 버전 (TRB 중재 소스 코드)
- FMZ의 새로운 거래 단말기 소개 (TRB 리비트 소스 추가)
- FMZ 퀀트: 암호화폐 시장에서 공통 요구 사항 설계 예제 분석 (II)
- 80 줄의 코드에서 고주파 전략으로 뇌 없는 판매봇을 이용하는 방법
- FMZ 정량화: 암호화폐 시장의 일반적인 요구 디자인 사례 분석 (II)
- 80줄의 코드의 고주파 전략으로 뇌 없는 로봇을 파는 방법
- FMZ Quant: 암호화폐 시장에서 공통 요구 사항 디자인 예의 분석 (I)
- FMZ 정량화: 암호화폐 시장의 일반적인 요구 디자인 사례 분석 (1)