닉 라이팍 후속 역전 (NRTR)
저자:차오장, 날짜: 2022-05-25 18:14:32태그:NRTR
이 지표는 2001년에 콘스탄틴 코피르킨에 의해 발명되었다.
코피르킨 -> 코피르 킨 -> 킨 코피르 -> 니크 리포크
지표의 아이디어는 캔들리어 출구와 유사하지만 ATR 구성 요소를 포함하지 않고 그 대신 비율을 사용합니다.
NRTR를 계산하기 위해 동적 가격 채널이 사용됩니다. 계산에는 현재 트렌드에 포함된 가격만 포함하고 이전 트렌드와 관련된 극단적 인 값을 제외합니다. 지표는 항상 가격에 도달한 극단적 인 가격 (현행 상승 추세의 최대 최고 이하, 현재 하락 추세의 최소 바닥 이상) 에서 동일한 거리에 있습니다.
백테스트
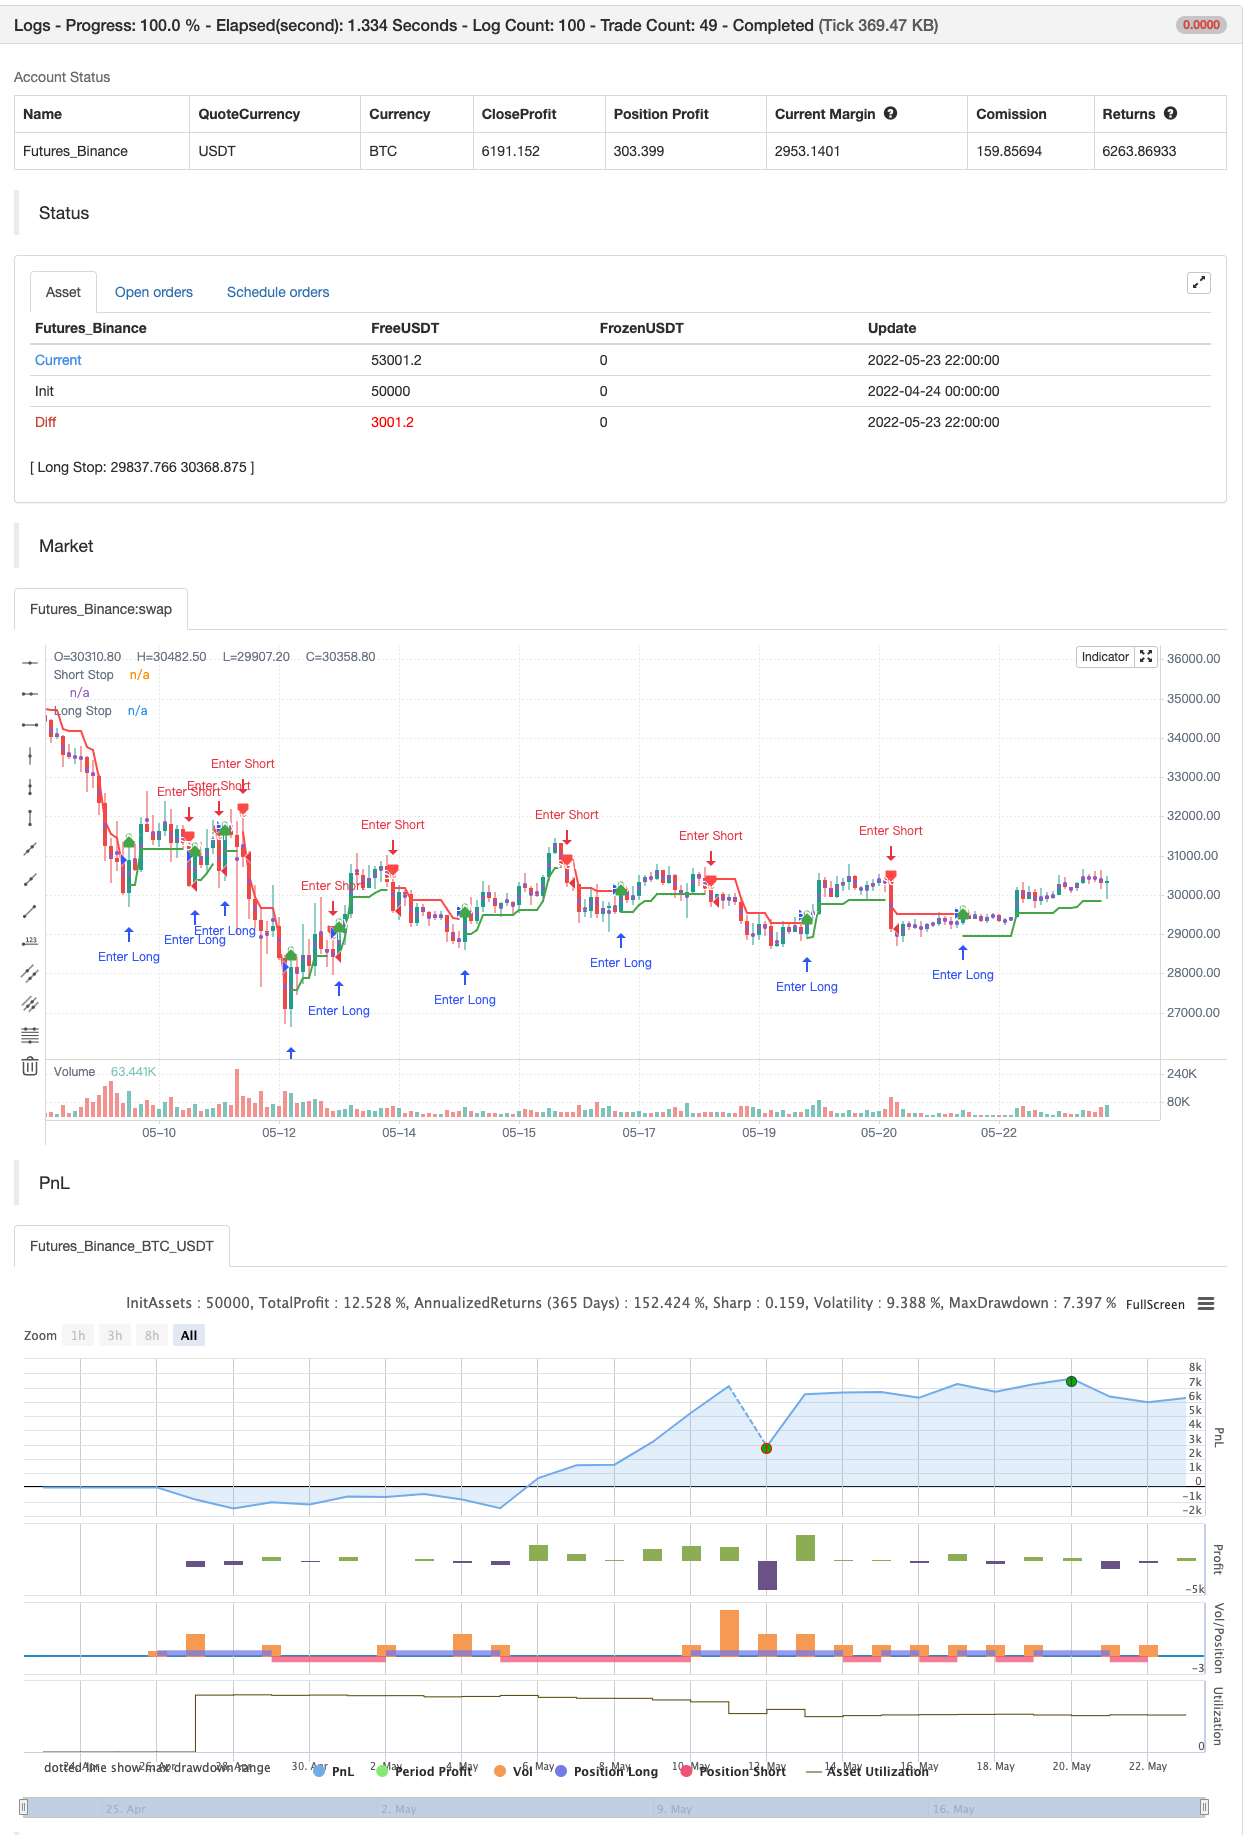
/*backtest
start: 2022-04-24 00:00:00
end: 2022-05-23 23:59:00
period: 2h
basePeriod: 15m
exchanges: [{"eid":"Futures_Binance","currency":"BTC_USDT"}]
*/

//@version=4
// Copyright (c) 2021-present, Alex Orekhov (everget)
study("Nick Rypock Trailing Reverse", shorttitle="NRTR", overlay=true)

k = input(title="Coefficient of Correction, %", type=input.float, minval=0, maxval=100, step=0.1, defval=2)
showLabels = input(title="Show Buy/Sell Labels ?", type=input.bool, defval=true)
applyRibbon = input(title="Apply Ribbon ?", type=input.bool, defval=true)

var int trend = 0
var float hp = close
var float lp = close
float nrtr = close

percentage = k * 0.01

if trend >= 0
	if close > hp
		hp := close
		hp
	nrtr := hp * (1 - percentage)
	if close <= nrtr
		trend := -1
		lp := close
		nrtr := lp * (1 + percentage)
		nrtr
else
	if close < lp
		lp := close
		lp
	nrtr := lp * (1 + percentage)
	if close > nrtr
		trend := 1
		hp := close
		nrtr := hp * (1 - percentage)
		nrtr

var color longColor = color.green
var color shortColor = color.red
var color textColor = color.white

longStopPlot = plot(trend == 1 ? nrtr : na, title="Long Stop", style=plot.style_linebr, linewidth=2, color=longColor)
buySignal = trend == 1 and trend[1] == -1
plotshape(buySignal ? nrtr : na, title="Long Stop Start", location=location.absolute, style=shape.circle, size=size.tiny, color=longColor, transp=0)
plotshape(buySignal and showLabels ? nrtr : na, title="Buy Label", text="Buy", location=location.absolute, style=shape.labelup, size=size.tiny, color=longColor, textcolor=textColor, transp=0)

shortStopPlot = plot(trend == 1 ? na : nrtr, title="Short Stop", style=plot.style_linebr, linewidth=2, color=shortColor)
sellSignal = trend == -1 and trend[1] == 1
plotshape(sellSignal ? nrtr : na, title="Short Stop Start", location=location.absolute, style=shape.circle, size=size.tiny, color=shortColor, transp=0)
plotshape(sellSignal and showLabels ? nrtr : na, title="Sell Label", text="Sell", location=location.absolute, style=shape.labeldown, size=size.tiny, color=shortColor, textcolor=textColor, transp=0)

midPricePlot = plot(ohlc4, title="", style=plot.style_circles, linewidth=0, display=display.none, editable=false)

longFillColor = applyRibbon ? (trend == 1 ? longColor : na) : na
shortFillColor = applyRibbon ? (trend == -1 ? shortColor : na) : na
fill(midPricePlot, longStopPlot, title="Long Ribbon", color=longFillColor)
fill(midPricePlot, shortStopPlot, title="Short Ribbon", color=shortFillColor)

changeCond = trend != trend[1]
alertcondition(changeCond, title="Alert: NRTR Direction Change", message="NRTR has changed direction!")
alertcondition(buySignal, title="Alert: NRTR Buy", message="NRTR Buy!")
alertcondition(sellSignal, title="Alert: NRTR Sell", message="NRTR Sell!")


if buySignal
    strategy.entry("Enter Long", strategy.long)
else if sellSignal
    strategy.entry("Enter Short", strategy.short)
관련
더 많은
- 구매/판매로 EMA ADX RSI를 스칼핑
- 부피 분차
- 슈퍼 트렌드 데일리 2.0 BF
- 헬스 이동 평균 스윙 트레이더
- FTSMA - 트렌드는 당신의 친구입니다
- 범위 필터 구매 및 판매
- SSL 채널
- 헬스 스위트 전략
- 파라볼 SAR 구매 및 판매
- 피보트 기반 후속 최대 & 최소
- ZigZag PA 전략 V4.1
- 내일 구매/판매
- 깨진 프랙탈: 누군가의 깨진 꿈은 당신의 이익입니다!
- 이윤 극대화 PMax
- 흠 이 없는 승리 전략
- 스토카스틱 + RSI, 이중 전략
- 스윙 헐/rsi/EMA 전략
- 스칼핑 스윙 거래 도구 R1-4
- 가장 좋은 삼키기 + 탈출 전략
- Bollinger Awesome 알렛 R1