FTSMA - 트렌드는 당신의 친구입니다
저자:차오장, 날짜: 2022-05-26 15:49:22태그:EMASMARMA
이것이 저의 새로운 확실한 전략입니다. 만약 여러분이
저는 많은 쌍과 많은 시간 프레임에서 테스트를 해왔고 설정의 작은 변화만으로도 수익을 얻었습니다. 내일 거래에 사용하라고 제안합니다.
매우 중요한 참고: 이것은 트렌드를 따르는 전략입니다. 따라서 목표는 가능한 한 거래에 머무르는 것입니다. 귀하의 거래 스타일이 스칼핑 및 / 또는 풀백에 더 집중되는 경우이 전략은 귀하를위한 것이 아닙니다.
이 전략은 트렌드 방향을 예측하기 위해 푸리에파에 적용되는 이동 평균을 사용합니다.
전략의 작동 방식:
- 빠른 MA가 중간 MA보다 높고 가격이 느린 MA보다 높을 때 구매합니다. 이는 트렌드 지표로 작용합니다.
- 빠른 MA가 중간 MA보다 낮고 가격이 느린 MA보다 낮을 때 판매합니다. 이는 트렌드 지표로 작용합니다.
전략은 많은 피라미드 주문을 사용합니다. 왜냐하면 평평한 시장 단계에서 1 또는 2 개의 주문을 손실로 닫을 것이기 때문입니다. 하지만 큰 트렌드가 시작되면 많은 주문에서 수익을 얻을 것입니다.
따라서, 전략 결과를 신중하게 분석하면, 당신은
코드에 언급된 모든 피너스크립터들에게 감사드린다.
또한 경고와 함께 연구를 가지고 있습니다. 다음 개선 (이 스크립트에 관심이 있고 나를 따르는 사람만): 한 번에 여러 티커에 경고를 가지고 공부합니다. 공부에 액세스하고 싶다면 댓글을 남겨주세요.
전략 을 어떻게 사용 하며 함께 공부 할 수 있습니까? 1- 먼저 전략 차트에 추가하여 작업 공간이 가능한 한 깨끗하게 유지됩니다. 2- 페이지의 풋에 있는 전략 테스터 탭을 열십시오. 3- 가장 좋은 결과를 얻기 위해 설정을 수정 (이익, 이윤 요인, 마감). 4- 같은 전략 설정으로 경고를 가진 연구를 차트에 추가하십시오. 저는 연구실과 함께 상세한 설치 가이드를 제공하겠습니다!
백테스트
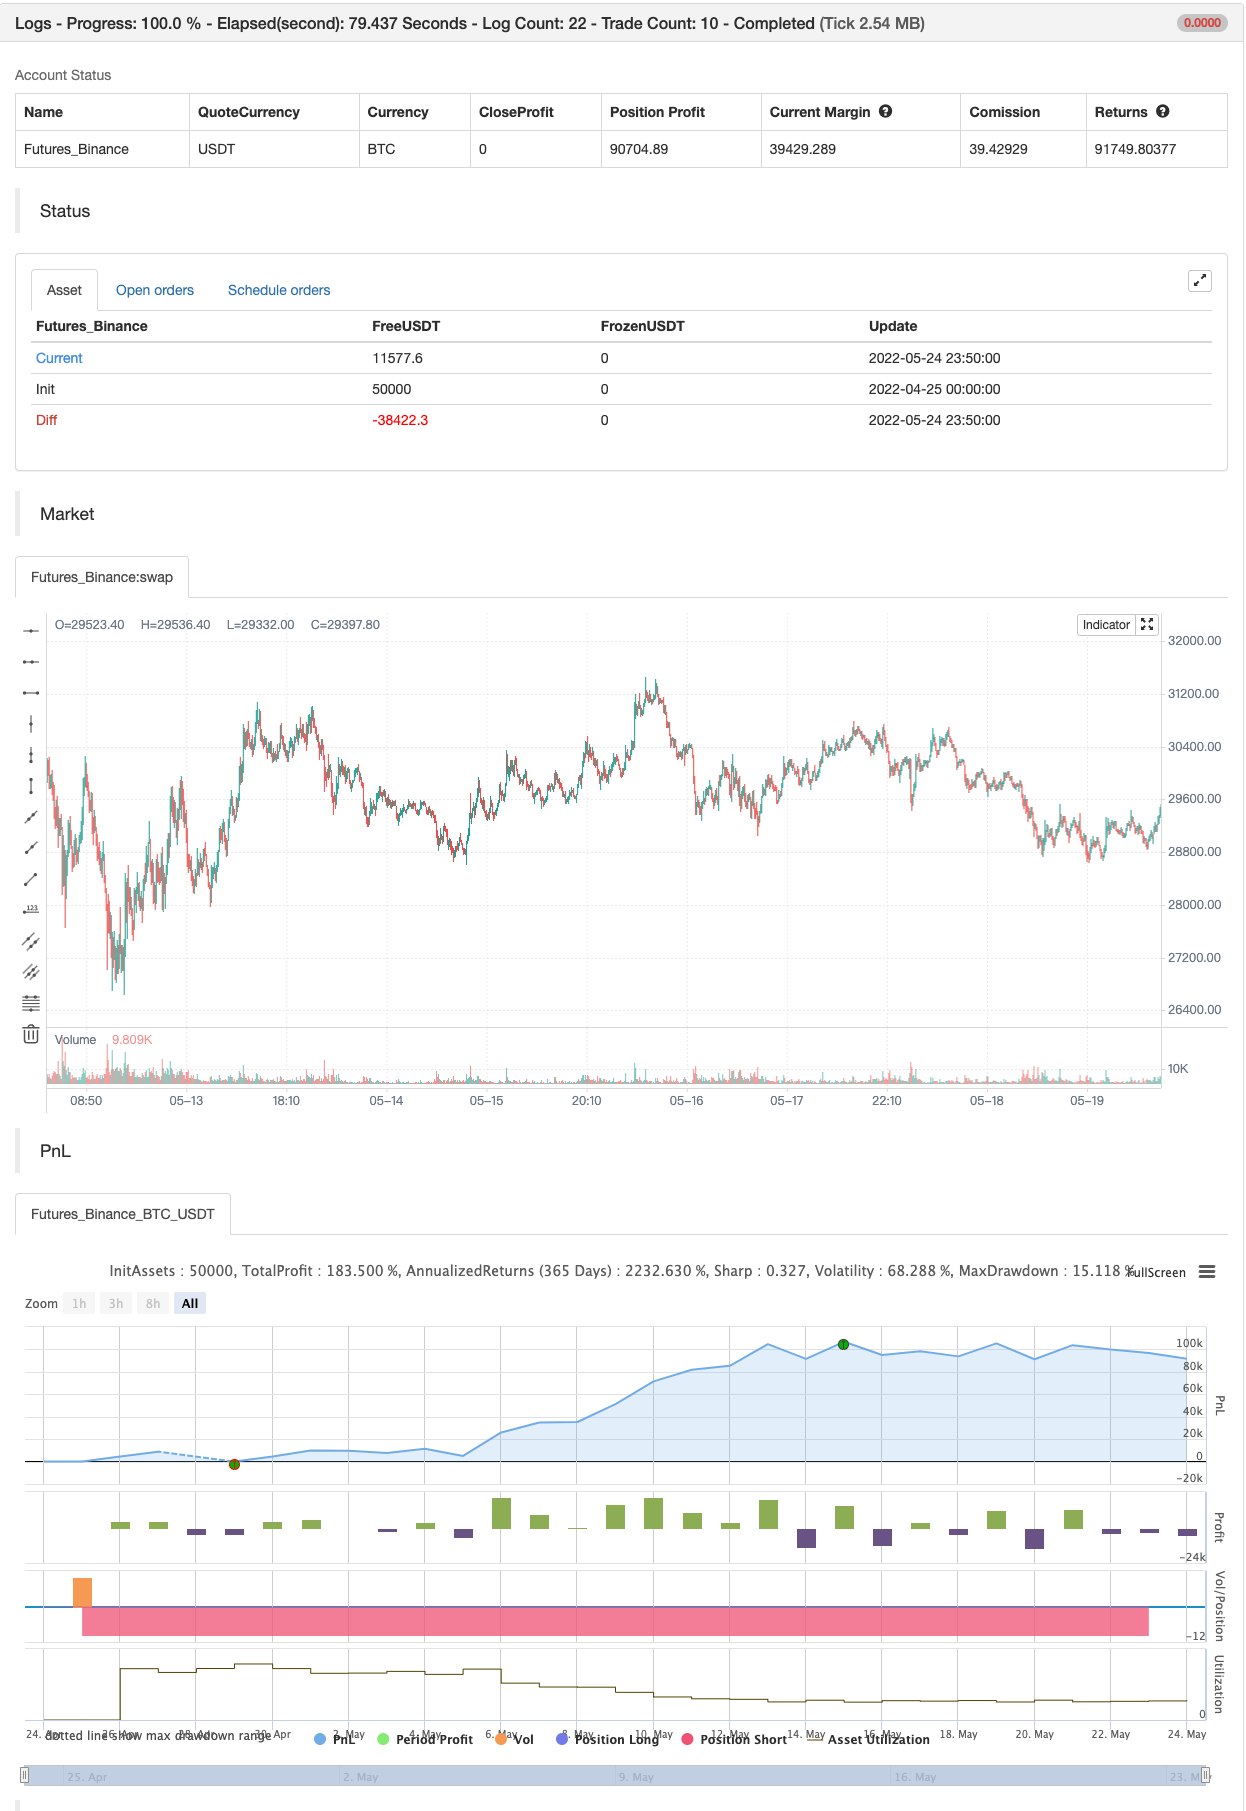
/*backtest
start: 2022-04-25 00:00:00
end: 2022-05-24 23:59:00
period: 10m
basePeriod: 1m
exchanges: [{"eid":"Futures_Binance","currency":"BTC_USDT"}]
*/

// This source code is subject to the terms of the Mozilla Public License 2.0 at https://mozilla.org/MPL/2.0/
// © 03.freeman

//@version=4
strategy("FTSMA", overlay=true, precision=6, initial_capital=10000,calc_on_every_tick=true, pyramiding=10, default_qty_type=strategy.fixed, default_qty_value=10000, currency=currency.EUR)
src=input(close,"Source")
slowMA=input(200,"Slow MA period")
mediumMA=input(20,"Mid MA period")
fastMA=input(5,"Fast MA period")
plotSMA=input(true,"Use MA")
sin1=input(1,"First sinusoid",minval=1)
sin2=input(2,"Second sinusoid",minval=1)
sin3=input(3,"Third sinusoid",minval=1)
smoothinput = input('EMA', title = "MA Type", options =['EMA', 'SMA', 'ALMA','FRAMA','RMA', 'SWMA', 'VWMA','WMA','LinearRegression'])
linearReg=input(false, "Use linear regression?")
linregLenght=input(13, "Linear regression lenght")
linregOffset=input(0, "Linear regression offset")

//------FRAMA ma---------
ma(src, len) =>
    float result = 0
    int len1 = len/2
    frama_SC=200
    frama_FC=1
    e = 2.7182818284590452353602874713527
    w = log(2/(frama_SC+1)) / log(e) // Natural logarithm (ln(2/(SC+1))) workaround
    H1 = highest(high,len1)
    L1 = lowest(low,len1)
    N1 = (H1-L1)/len1
    H2_ = highest(high,len1)
    H2 = H2_[len1]
    L2_ = lowest(low,len1)
    L2 = L2_[len1]
    N2 = (H2-L2)/len1
    H3 = highest(high,len)
    L3 = lowest(low,len)
    N3 = (H3-L3)/len
    dimen1 = (log(N1+N2)-log(N3))/log(2)
    dimen = iff(N1>0 and N2>0 and N3>0,dimen1,nz(dimen1[1]))
    alpha1 = exp(w*(dimen-1))
    oldalpha = alpha1>1?1:(alpha1<0.01?0.01:alpha1)
    oldN = (2-oldalpha)/oldalpha
    N = (((frama_SC-frama_FC)*(oldN-1))/(frama_SC-1))+frama_FC
    alpha_ = 2/(N+1)
    alpha = alpha_<2/(frama_SC+1)?2/(frama_SC+1):(alpha_>1?1:alpha_)
    frama = 0.0
    frama :=(1-alpha)*nz(frama[1]) + alpha*src
    result := frama
    result

// ----------MA calculation - ChartArt and modified by 03.freeman-------------
calc_ma(src,l) =>
    _ma = smoothinput=='SMA'?sma(src, l):smoothinput=='EMA'?ema(src, l):smoothinput=='WMA'?wma(src, l):smoothinput=='LinearRegression'?linreg(src, l,0):smoothinput=='VWMA'?vwma(src,l):smoothinput=='RMA'?rma(src, l):smoothinput=='ALMA'?alma(src,l,0.85,6):smoothinput=='SWMA'?swma(src):smoothinput=='FRAMA'?ma(sma(src,1),l):na

//----------------------------------------------


//pi = acos(-1)
// Approximation of Pi in _n terms --- thanks to e2e4mfck
f_pi(_n) =>
    _a = 1. / (4. * _n + 2)
    _b = 1. / (6. * _n + 3)
    _pi = 0.
    for _i = _n - 1 to 0
        _a := 1 / (4. * _i + 2) - _a / 4.
        _b := 1 / (6. * _i + 3) - _b / 9.
    _pi := (4. * _a) + (4. * _b) - _pi
pi=f_pi(20)

//---Thanks to xyse----https://www.tradingview.com/script/UTPOoabQ-Low-Frequency-Fourier-Transform/
//Declaration of user-defined variables
N = input(defval=64, title="Lookback Period", type=input.integer, minval=2, maxval=600, confirm=false, step=1, options=[2,4,8,16,32,64,128,256,512,1024,2048,4096])

//Real part of the Frequency Domain Representation
ReX(k) =>
    sum = 0.0
    for i=0 to N-1
        sum := sum + src[i]*cos(2*pi*k*i/N)
    return = sum

//Imaginary part of the Frequency Domain Representation
ImX(k) =>
    sum = 0.0
    for i=0 to N-1
        sum := sum + src[i]*sin(2*pi*k*i/N)
    return = -sum

//Get sinusoidal amplitude from frequency domain
ReX_(k) =>
    case = 0.0
    if(k!=0 and k!=N/2)
        case := 2*ReX(k)/N
    if(k==0)
        case := ReX(k)/N
    if(k==N/2)
        case := ReX(k)/N
    return = case

 //Get sinusoidal amplitude from frequency domain
ImX_(k) =>
    return = -2*ImX(k)/N

//Get full Fourier Transform
x(i, N) =>
    sum1 = 0.0
    sum2 = 0.0
    for k=0 to N/2
        sum1 := sum1 + ReX_(k)*cos(2*pi*k*i/N)
    for k=0 to N/2
        sum2 := sum2 + ImX_(k)*sin(2*pi*k*i/N)
    return = sum1+sum2

//Get single constituent sinusoid
sx(i, k) =>
    sum1 = ReX_(k)*cos(2*pi*k*i/N)
    sum2 = ImX_(k)*sin(2*pi*k*i/N)
    return = sum1+sum2
//Calculations for strategy
SLOWMA = plotSMA?calc_ma(close+sx(0,sin1),slowMA):close+sx(0,sin1)
MEDMA = plotSMA?calc_ma(close+sx(0,sin2),mediumMA):close+sx(0,sin2)
FASTMA = plotSMA?calc_ma(close+sx(0,sin3),fastMA):close+sx(0,sin3)

SLOWMA := linearReg?linreg(SLOWMA,linregLenght,linregOffset):SLOWMA
MEDMA := linearReg?linreg(MEDMA,linregLenght,linregOffset):MEDMA
FASTMA := linearReg?linreg(FASTMA,linregLenght,linregOffset):FASTMA

//Plot 3 Low-Freq Sinusoids
plot(SLOWMA, color=color.green)
plot(MEDMA, color=color.red)
plot(FASTMA, color=color.blue)

//  Strategy: (Thanks to JayRogers)
// === STRATEGY RELATED INPUTS ===
// the risk management inputs
inpTakeProfit   = input(defval = 0, title = "Take Profit Points", minval = 0)
inpStopLoss     = input(defval = 0, title = "Stop Loss Points", minval = 0)
inpTrailStop    = input(defval = 0, title = "Trailing Stop Loss Points", minval = 0)
inpTrailOffset  = input(defval = 0, title = "Trailing Stop Loss Offset Points", minval = 0)

// === RISK MANAGEMENT VALUE PREP ===
// if an input is less than 1, assuming not wanted so we assign 'na' value to disable it.
useTakeProfit   = inpTakeProfit  >= 1 ? inpTakeProfit  : na
useStopLoss     = inpStopLoss    >= 1 ? inpStopLoss    : na
useTrailStop    = inpTrailStop   >= 1 ? inpTrailStop   : na
useTrailOffset  = inpTrailOffset >= 1 ? inpTrailOffset : na

longCondition = FASTMA>MEDMA and close > SLOWMA             //crossover(FASTMA, MEDMA) and close > SLOWMA
if (longCondition)
    strategy.entry("Long Entry", strategy.long)

shortCondition = FASTMA<MEDMA and close < SLOWMA            //crossunder(FASTMA, MEDMA) and close < SLOWMA
if (shortCondition)
    strategy.entry("Short Entry", strategy.short)

// === STRATEGY RISK MANAGEMENT EXECUTION ===
// finally, make use of all the earlier values we got prepped
strategy.exit("Exit Buy", from_entry = "Long Entry", profit = useTakeProfit, loss = useStopLoss, trail_points = useTrailStop, trail_offset = useTrailOffset)
strategy.exit("Exit Sell", from_entry = "Short Entry", profit = useTakeProfit, loss = useStopLoss, trail_points = useTrailStop, trail_offset = useTrailOffset)
- MA 하이브리드 BY RAJ
- SSL 하이브리드
- 레인보우 오시레이터
- 달 발사 경고 템플릿 [지표]
- 슈퍼 점프 턴 백 볼링거 밴드
- 슈퍼 스칼퍼
- ESSMA
- 더 똑똑한 MACD
- 슈퍼 스칼퍼 - 5분 15분
- 구매/판매로 EMA ADX RSI를 스칼핑