적응형 변동성을 기반으로 한 유한 볼륨 요소 전략

개요
이 전략은 제한된 부피 요소 방법을 사용하여, 변동성 측정과 함께 가격 변화에 대한 다공간 판단을 수행하며, 트렌드 추적 유형 전략에 속한다. 이 전략은 각 시간 주기에 적용되며, 다양한 변동성 수준에 적응하기 위해 매개 변수를 자동으로 조정할 수 있다.
원칙
전략은 가장 최근의 N 루트 K 선의 높고 낮은 평균값, 닫기 가격 평균값, 그리고 이전 K 선의 높고 낮은 닫기 가격 평균값을 먼저 계산한다. 그 다음에는 현재 K 선과 이전 K 선의 대수익률 인트라와 인터 (Intra and Inter) 을 계산한다. 또한 인트라와 인터 (Intra and Inter) 의 변동성 Vintra와 Vinter (Vinter) 을 계산한다.
변동성 수준과 조정 가능한 파라미터를 기준으로, 적응 절단 계수인 CutOff를 계산한다. 가격 변화가 CutOff을 초과할 때, 공백 신호를 준다. 구체적으로, MF가 CutOff보다 크면 다단계 신호로, MF가 마이너스보다 작으면 공백 신호로, 현재 K선 종료 가격과 높은 낮은 평균값의 차이를 계산한다.
마지막으로, 신호에 따라 자금 흐름을 계산하고, 신호 pos를 출력하며, 제한적 부피 요소 곡선을 FVE <unk>로 그려낸다.
장점
- 자기 적응 파라미터, 다른 주기 및 변동성 수준에 적용, 인력 조정 필요 없다.
- 가격 동향의 변화를 정확하게 포착한다.
- 유한 부피 요소 곡선은 다공력 대조를 명확하게 반영한다.
- 자금 흐름 이론적 기반이 튼튼하고, 신호가 신뢰성이 높습니다.
위험
- 시장이 급격하게 흔들릴 때, 더 많은 잘못된 신호가 발생할 수 있다. N 파라미터를 적절히 조정할 수 있다.
- 가격 폭등을 처리할 수 없습니다. 다른 지표의 조합을 고려할 수 있습니다.
- 자금 흐름 이론과 기술 분석 신호가 이탈할 수 있다. 여러 가지 신호의 통합 판단을 고려할 수 있다.
최적화 방향
- 다른 N 변수의 결과에 대한 영향을 테스트할 수 있다. 일반적으로 N 값이 더 크면 과잉 노이즈를 필터링할 수 있다.
- Cintra와 Cinter의 다른 값을 테스트하여 최적의 파라미터 조합을 찾을 수 있습니다. 또한 이 두 파라미터를 동적으로 조정하는 것도 고려할 수 있습니다.
- 전략의 안정성을 높이기 위해 MACD와 같은 다른 지표와 조합을 고려할 수 있습니다.
- 단독 손실을 통제하기 위해 손해 방지 장치를 설치할 수 있습니다.
요약하다
이 전략은 전체적으로 신뢰성이 높고, 원칙이 우수하며, 트렌드 추적 전략의 구성 요소로 사용할 수 있으며, 다른 전략과 적절히 결합하면 효과가 더 좋다. 핵심은 최적의 매개 변수를 찾아, 좋은 풍력 조절 조치를 구축하는 것이다. 후기에는 계속 최적화할 수 있다면, 매우 강력한 트렌드 추적 전략이 될 것이다.
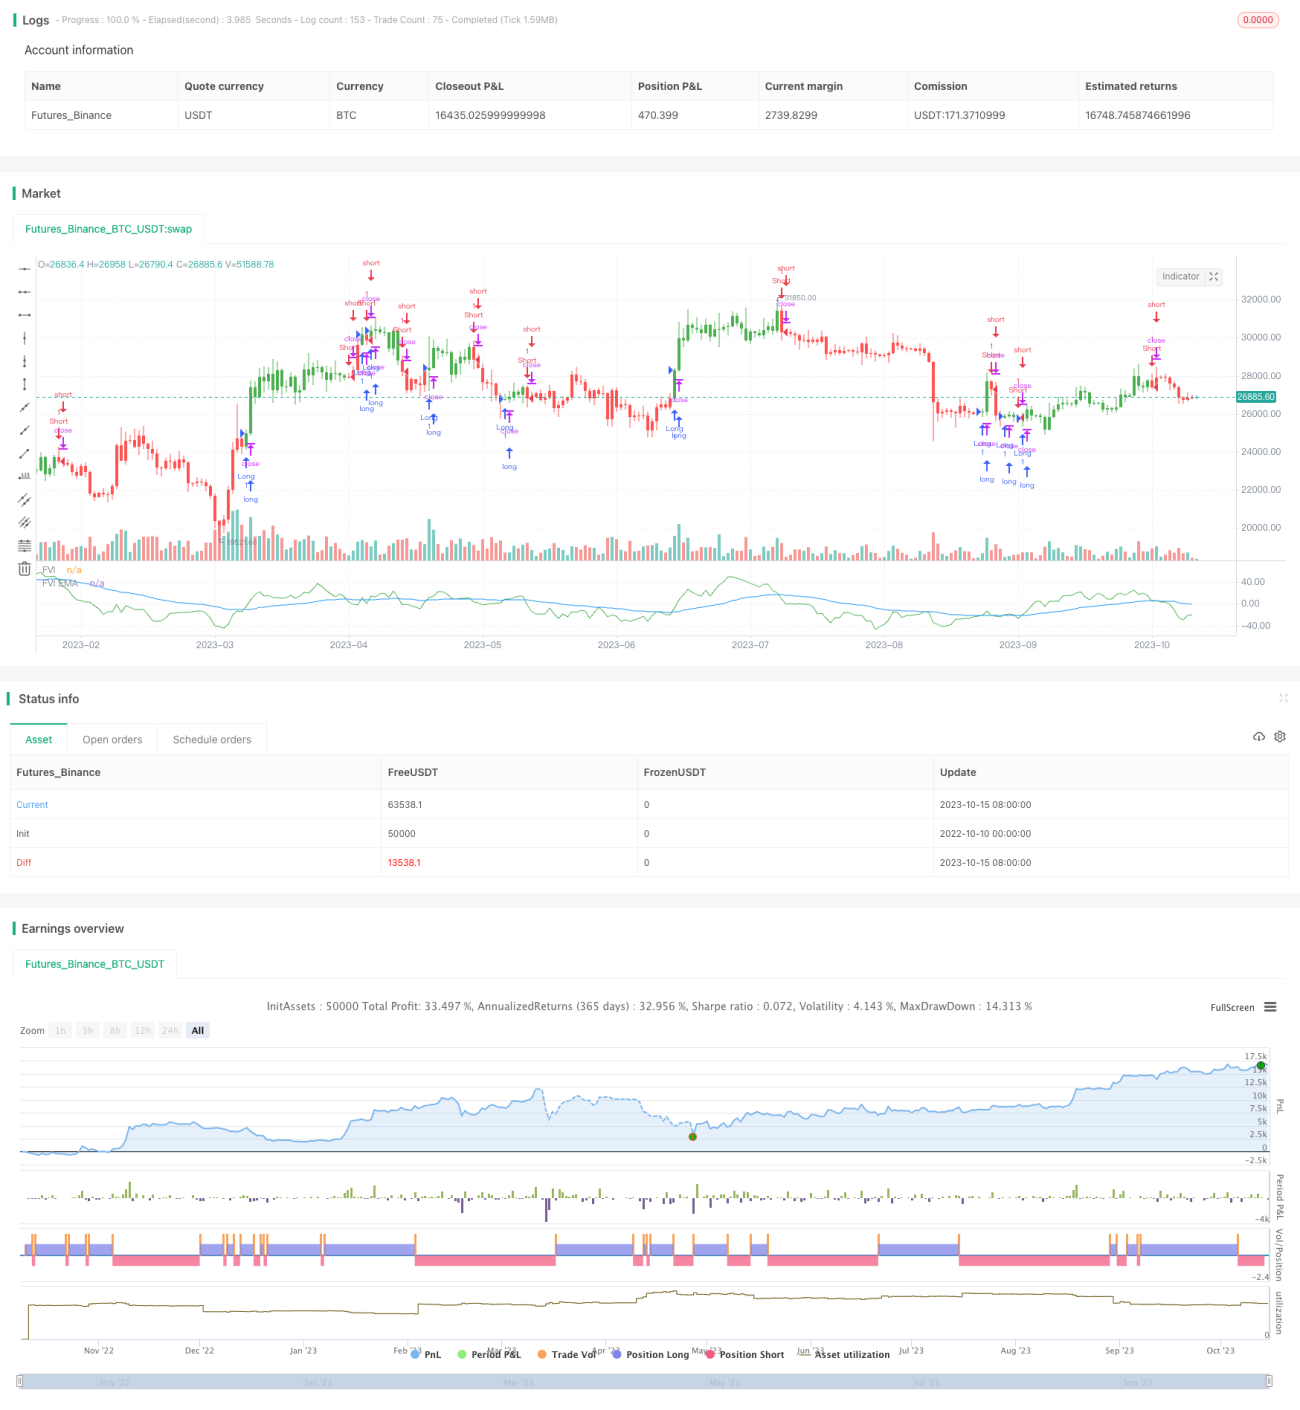
/*backtest
start: 2022-10-10 00:00:00
end: 2023-10-16 00:00:00
period: 1d
basePeriod: 1h
exchanges: [{"eid":"Futures_Binance","currency":"BTC_USDT"}]
*/

//@version=2
////////////////////////////////////////////////////////////
//  Copyright by HPotter v1.0 18/08/2017
// This is another version of FVE indicator that we have posted earlier - 1