이동평균 교차 다중층 이익 전략

1
Follow
1785
Followers
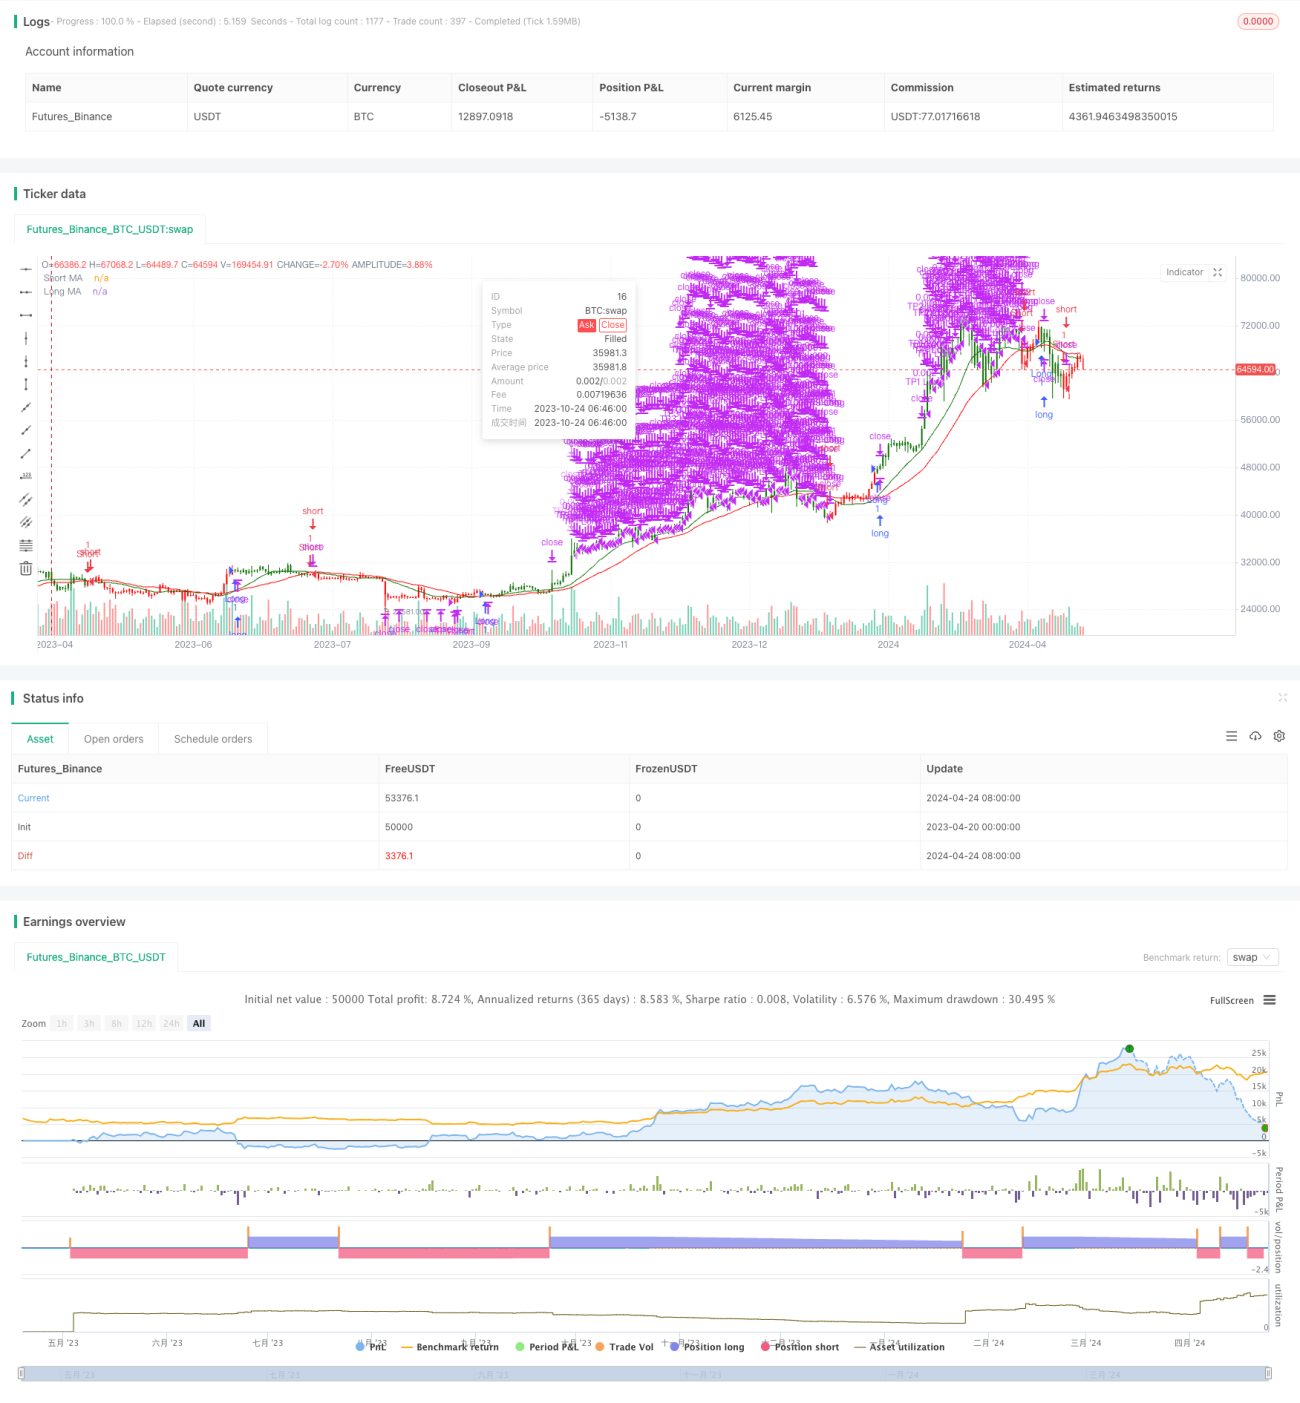
개요
이 전략은 두 개의 이동 평균의 교차를 사용하여 시장의 흐름을 판단하고, 단기 이동 평균에 장기 이동 평균을 가로질러 더 많은 포지션을 열고, 반대로 포지션을 열습니다. 동시에, 이 전략은 여러 단계의 수익을 얻은 후 종료하는 방식을 채택하고, 가격이 예상된 수익 수준에 도달했을 때 포지션을 순차적으로 청산하여 수익을 극대화하고 위험을 제어합니다.
전략 원칙
이 전략의 핵심은 시장의 추세를 잡기 위해 다양한 주기의 이동 평균을 이용하는 것이다. 단기 이동 평균 위에 장기 이동 평균을 통과하면 시장이 상승 추세에 들어갈 수 있음을 의미하며, 이때 더 많은 포지션을 열고, 단기 이동 평균 아래에 장기 이동 평균을 통과하면 시장이 하향 추세에 들어갈 수 있음을 의미하며, 이때 공백 포지션을 열다. 동시에, 이 전략은 여러 개의 수익 수준을 설정하고, 가격이 이러한 수준에 도달하면, 미리 설정된 포지션 비율에 따라 공백 포지션을 설정하여, 추세가 지속될 때 더 많은 수익을 얻을 수 있으며, 동시에 위험을 통제한다.
전략적 이점
- 간단하고 효과적: 이 전략은 클래식 이동 평균의 교차 원리에 기초하여 간단하고 이해하기 쉽고, 실무에서 효과적이라는 것을 증명했습니다.
- 다단계 수익결제: 여러 수익수준을 설정하고, 가격이 이 수준에 도달했을 때 순차적으로 청산함으로써 수익을 극대화할 수 있으며, 동시에 위험을 통제할 수 있다.
- 변수 유연성: 이 전략의 변수 설정은 매우 유연하며, 사용자는 자신의 요구와 시장 특성에 따라 이동 평균 주기 및 수익 수준을 조정하여 최적의 효과를 얻을 수 있습니다.
전략적 위험
- 시장 변동 위험: 시장이 급격히 변동할 때, 자주 교차하는 신호는 전략의 자주 거래로 이어질 수 있으며 거래 비용과 철회 위험을 증가시킵니다.
- 매개 변수 설정 위험: 부적절한 매개 변수 설정은 이동 평균 주기를 잘못 선택하거나 수익 수준을 부합적으로 설정하는 등 전략의 부적절한 성과를 초래할 수 있습니다.
- 트렌드 인식 위험: 이 전략은 주로 트렌드에 의존하며, 흔들리는 시장이나 트렌드가 명확하지 않을 때, 더 많은 가짜 신호가 발생할 수 있으며, 이로 인해 손실이 발생할 수 있다.
전략 최적화 방향
- 다른 지표와 결합: 트렌드 식별의 정확성과 신뢰성을 높이기 위해 RSI, MACD 등과 같은 다른 기술 지표와 결합하는 것이 고려 될 수 있습니다.
- 최적화 매개 변수: 다양한 시장 상황에 맞게 최적의 이동 평균 주기 및 수익 수준 매개 변수를 찾아서 추적 및 최적화 할 수 있습니다.
- 스톱을 추가: ATR 설정에 따라 동적 스톱과 같은 위험을 더 제어하기 위해 스톱 메커니즘을 추가하는 것이 고려 될 수 있습니다.
- 진출 및 출구 변경: 전략의 안정성을 높이기 위해 거래량, 지원 저항과 같은 요소를 고려하여 더 많은 진출 및 출구 조건을 탐색 할 수 있습니다.
요약하다
이동 평균 교차 다층 수익 전략은 단순한 효과적인 트렌드 추적 전략으로, 다층 수익 결실을 통해 트렌드에서 더 많은 수익을 얻을 수 있으며, 동시에 위험을 통제할 수 있다. 그러나, 이 전략에는 또한 몇 가지 제한과 위험이 있으며, 특정 시장 상황과 사용자 요구에 따라 최적화 및 개선이 필요합니다.
Source
Pine
/*backtest
start: 2023-04-20 00:00:00
end: 2024-04-25 00:00:00
period: 1d
basePeriod: 1h
exchanges: [{"eid":"Futures_Binance","currency":"BTC_USDT"}]
*/

// This Pine Script™ code is subject to the terms of the Mozilla Public License 2.0 at https://mozilla.org/MPL/2.0/
// © ValdesTradingBots

//Follow Us for More Insights and Updates!Strategy parameters
Related strategies
Comment
All comments (0)
No data
- 1