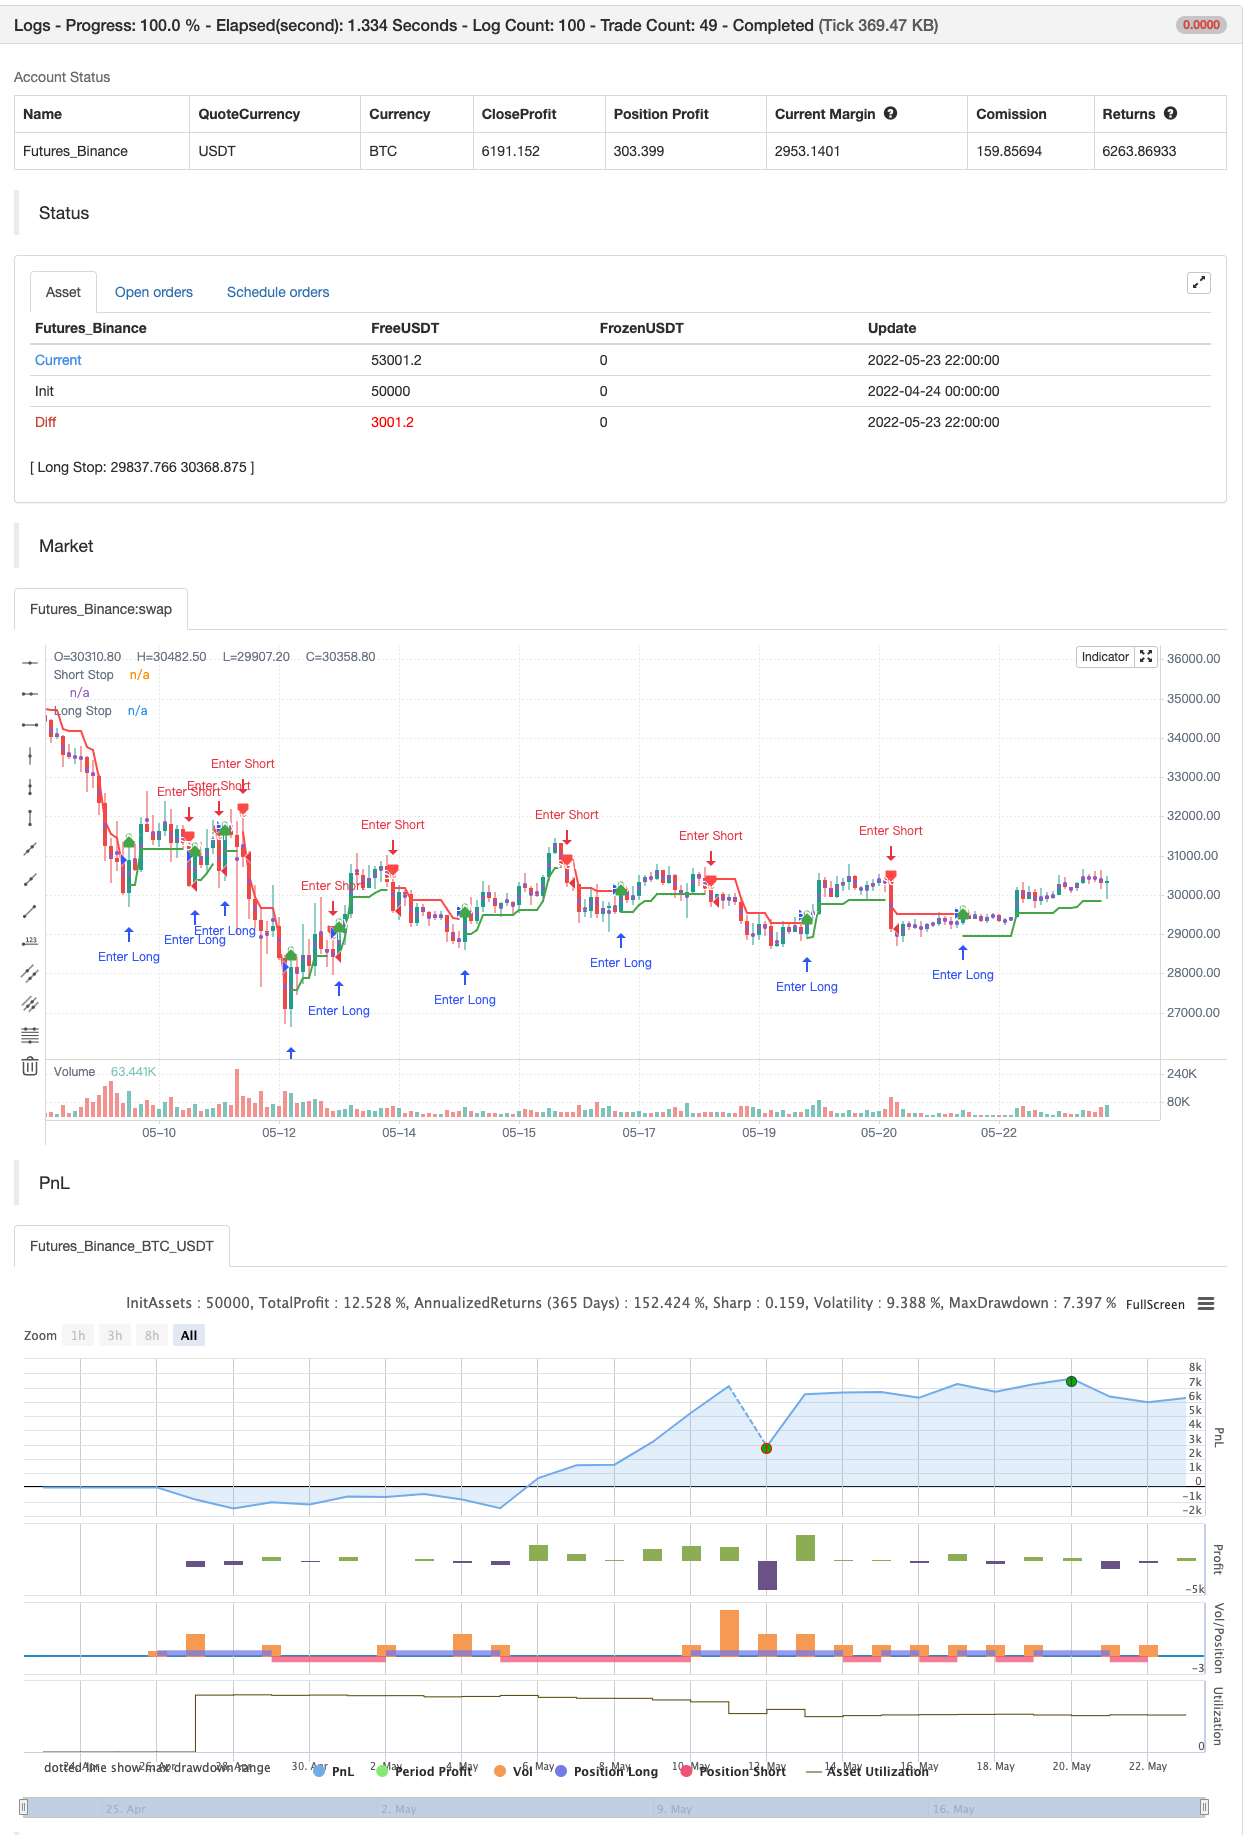
Nick Rypock Trailing Reverse (NRTR)
Autora:ChaoZhang, Data: 2022-05-25 18:14:32Tags:NRTR
Este indicador foi inventado em 2001 por Konstantin Kopyrkin.
Kopyrkin -> Kopyr Kin -> Kin Kopyr -> Nik Rypok
A ideia do indicador é semelhante ao Chandelier Exit, mas não envolve o componente ATR e usa uma porcentagem em vez disso.
Um canal de preços dinâmico é usado para calcular o NRTR. Os cálculos envolvem apenas os preços que estão incluídos na tendência atual e excluem os extremos relacionados à tendência anterior. O indicador está sempre na mesma distância (em porcentagem) dos extremos alcançados pelos preços (abaixo do pico máximo para a tendência de alta atual, acima do fundo mínimo para a tendência de baixa atual).
backtest

/*backtest
start: 2022-04-24 00:00:00
end: 2022-05-23 23:59:00
period: 2h
basePeriod: 15m
exchanges: [{"eid":"Futures_Binance","currency":"BTC_USDT"}]
*/

//@version=4
// Copyright (c) 2021-present, Alex Orekhov (everget)
study("Nick Rypock Trailing Reverse", shorttitle="NRTR", overlay=true)

k = input(title="Coefficient of Correction, %", type=input.float, minval=0, maxval=100, step=0.1, defval=2)
showLabels = input(title="Show Buy/Sell Labels ?", type=input.bool, defval=true)
applyRibbon = input(title="Apply Ribbon ?", type=input.bool, defval=true)

var int trend = 0
var float hp = close
var float lp = close
float nrtr = close

percentage = k * 0.01

if trend >= 0
	if close > hp
		hp := close
		hp
	nrtr := hp * (1 - percentage)
	if close <= nrtr
		trend := -1
		lp := close
		nrtr := lp * (1 + percentage)
		nrtr
else
	if close < lp
		lp := close
		lp
	nrtr := lp * (1 + percentage)
	if close > nrtr
		trend := 1
		hp := close
		nrtr := hp * (1 - percentage)
		nrtr

var color longColor = color.green
var color shortColor = color.red
var color textColor = color.white

longStopPlot = plot(trend == 1 ? nrtr : na, title="Long Stop", style=plot.style_linebr, linewidth=2, color=longColor)
buySignal = trend == 1 and trend[1] == -1
plotshape(buySignal ? nrtr : na, title="Long Stop Start", location=location.absolute, style=shape.circle, size=size.tiny, color=longColor, transp=0)
plotshape(buySignal and showLabels ? nrtr : na, title="Buy Label", text="Buy", location=location.absolute, style=shape.labelup, size=size.tiny, color=longColor, textcolor=textColor, transp=0)

shortStopPlot = plot(trend == 1 ? na : nrtr, title="Short Stop", style=plot.style_linebr, linewidth=2, color=shortColor)
sellSignal = trend == -1 and trend[1] == 1
plotshape(sellSignal ? nrtr : na, title="Short Stop Start", location=location.absolute, style=shape.circle, size=size.tiny, color=shortColor, transp=0)
plotshape(sellSignal and showLabels ? nrtr : na, title="Sell Label", text="Sell", location=location.absolute, style=shape.labeldown, size=size.tiny, color=shortColor, textcolor=textColor, transp=0)

midPricePlot = plot(ohlc4, title="", style=plot.style_circles, linewidth=0, display=display.none, editable=false)

longFillColor = applyRibbon ? (trend == 1 ? longColor : na) : na
shortFillColor = applyRibbon ? (trend == -1 ? shortColor : na) : na
fill(midPricePlot, longStopPlot, title="Long Ribbon", color=longFillColor)
fill(midPricePlot, shortStopPlot, title="Short Ribbon", color=shortFillColor)

changeCond = trend != trend[1]
alertcondition(changeCond, title="Alert: NRTR Direction Change", message="NRTR has changed direction!")
alertcondition(buySignal, title="Alert: NRTR Buy", message="NRTR Buy!")
alertcondition(sellSignal, title="Alert: NRTR Sell", message="NRTR Sell!")


if buySignal
    strategy.entry("Enter Long", strategy.long)
else if sellSignal
    strategy.entry("Enter Short", strategy.short)
Relacionados
Mais.
- Scalping EMA ADX RSI com compra/venda
- Divergência de volume
- Super Trend Daily 2.0 BF
- Hull Moving Average Swing Trader
- FTSMA - Trend é o teu amigo
- Filtro de faixa Comprar e vender
- Canal SSL
- Estratégia do Hull Suite
- Parabólica SAR Compra e Venda
- Maxima e Mínima baseadas em pivô
- ZigZag PA Estratégia V4.1
- Comprar/Vender intradiário
- Fractal quebrado: o sonho quebrado de alguém é o seu lucro!
- Maximizador de lucro PMax
- Estratégia de vitória perfeita
- Estocástico + RSI, Estratégia Dupla
- Estratégia Swing Hull/rsi/EMA
- Instrumento de negociação Swing Scalping R1-4
- A melhor estratégia de engolf + escape
- Alerta Bollinger Awesome R1