Scalping EMA ADX RSI com compra/venda
Autora:ChaoZhang, Data: 26 de Maio de 2022 17:11:01Tags:ADXRMARSIEMASMAWMA
Este é um indicador de estudo que mostra as entradas na estratégia vista em um dos canais do youtube, então não me pertence. Eu não posso dizer quem é porque é contra as Regras da Casa para anunciar, mas você pode descobrir se procurar no youtube. Valores padrão de osciladores e ema ajustados conforme sugerido. Ele diz que ele obteve os melhores resultados em 5 minutos de tempo, mas eu tentei fazer as coisas tão modificáveis quanto possível para que você possa mexer com as configurações e criar sua própria estratégia para diferentes prazos, se quiser. Sugere-se usar com gráficos normais de velas. A linha azul abaixo indica que o ADX está acima do limiar selecionado definido nas configurações chamado
A estratégia de entrada em si é bastante simples. As regras de entrada são as seguintes, o script vai verificar tudo isso no auto e vai dar-lhe um sinal de compra ou venda: Tempo recomendado: 5 min.
Para entrada prolongada:
- Verifique se o preço está acima da EMA definida (Pode desativar esta regra se quiser nas configurações)
- O RSI está em sobrevenda
- ADX está acima do limiar
Trend Ready (significando que há uma tendência em curso) - O preço deve aprovar a tendência das velas anteriores.
- Entrar com stop loss abaixo do último swing baixo com 1:1 ou 1,5:1 take profit ratio.
Para a entrada curta:
- Verifique se o preço está abaixo da EMA definida (Pode desativar esta regra se quiser nas configurações)
- RSI está em Overbought
- ADX está acima do limiar
Trend Ready (significando que há uma tendência em curso) - O preço deve aprovar a tendência das velas anteriores.
- Entre com stop loss acima da última alta de swing com 1:1 ou 1,5:1 take profit ratio.
Este é o meu primeiro indicador. Avise-me se quiser alguma atualização. Não sei se posso adicionar tudo, mas vou tentar.
Alterado: Os sinais verificarão até 2 velas antes se o RSI estiver abaixo ou acima do valor definido para mostrar o sinal.
backtest
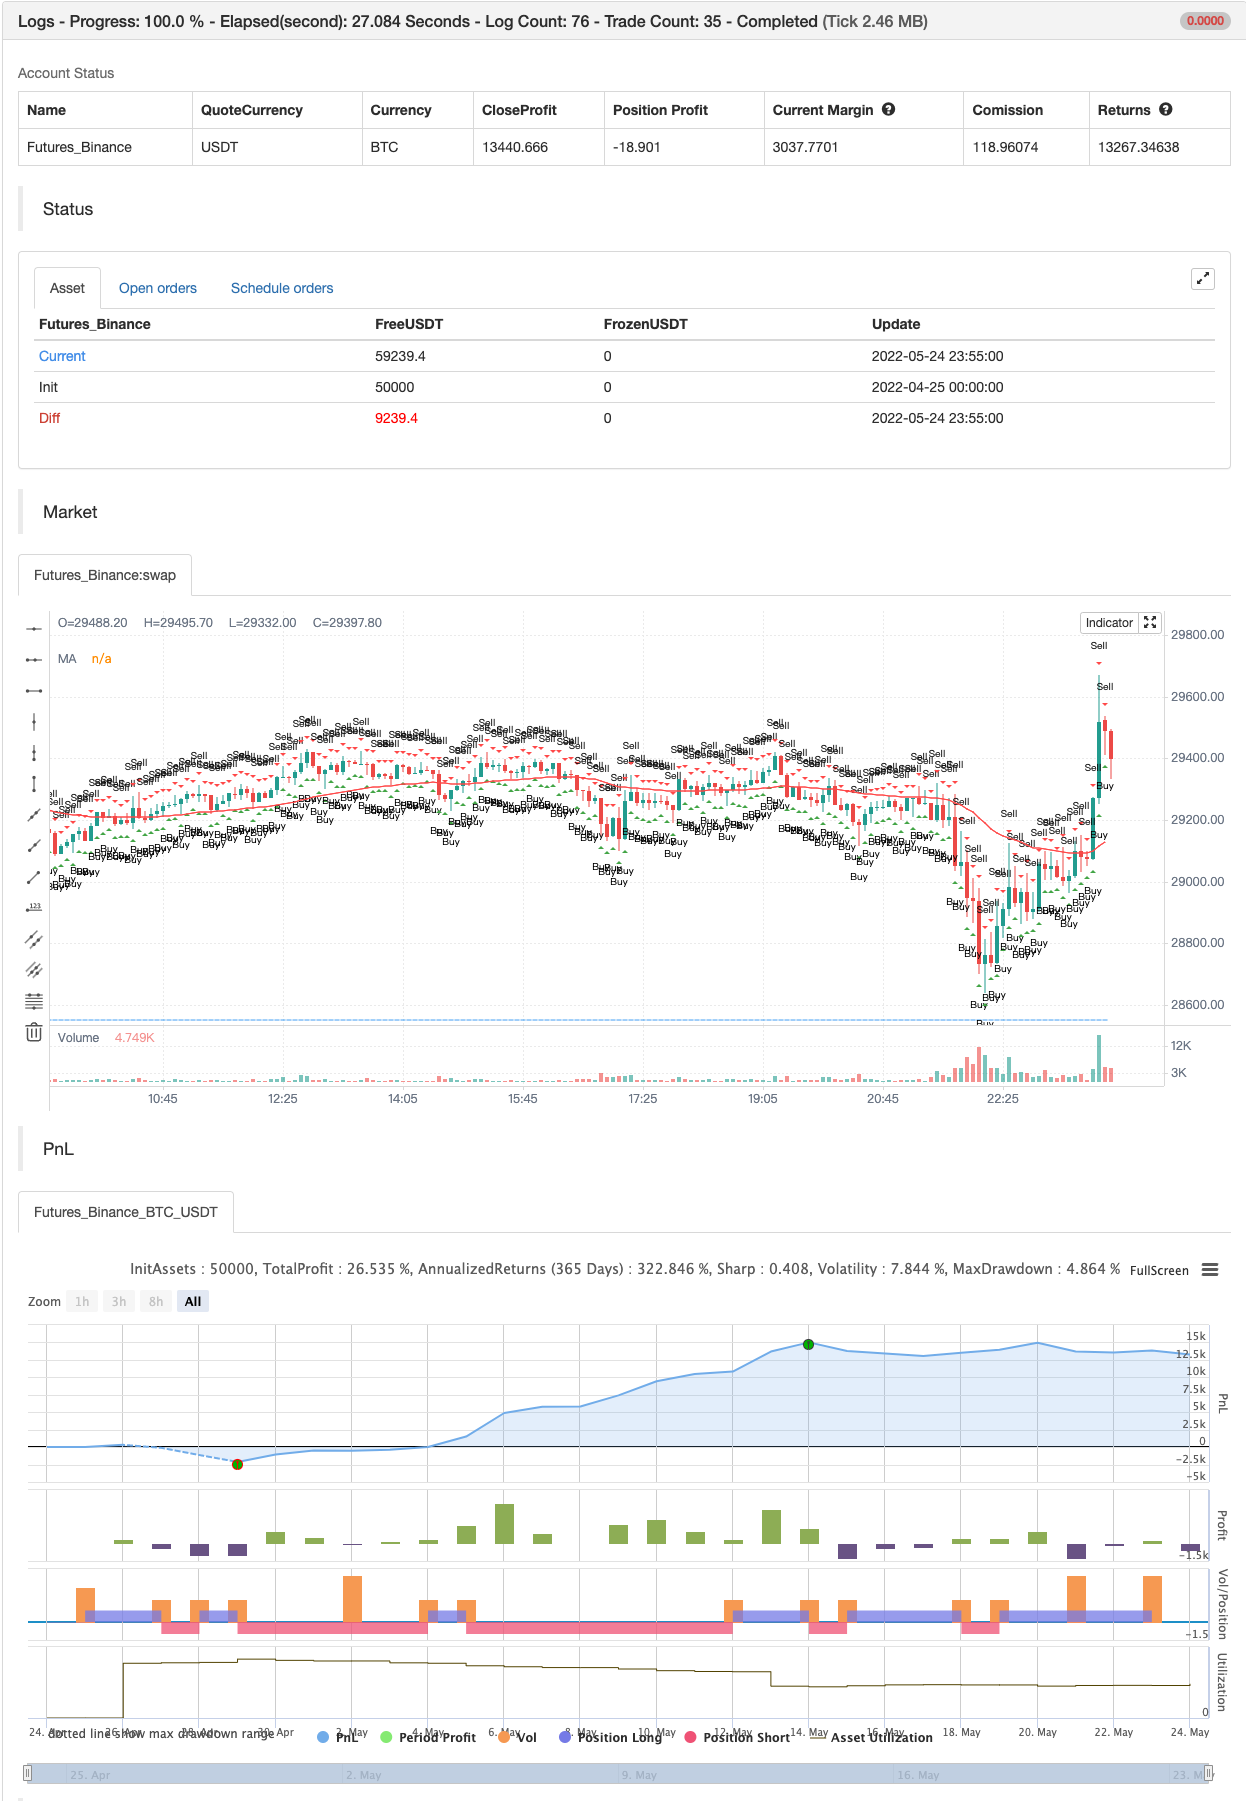
/*backtest
start: 2022-04-25 00:00:00
end: 2022-05-24 23:59:00
period: 5m
basePeriod: 1m
exchanges: [{"eid":"Futures_Binance","currency":"BTC_USDT"}]
*/

//@version=5
indicator(title='EMA RSI ADX Scalping Alerts', shorttitle="ERA Scalper", overlay=true)

//Define MA Inputs and group them
maType = input.string(title="MA Type", options=["EMA", "SMA", "WMA", "VWMA", "HMA", "RMA", "DEMA", "TEMA", "LSMA", "ZLSMA"], defval="EMA", group='MA Settings')
emaSource = input.source(title='MA Source', defval=close, group='MA Settings')
emaLength = input.int(title='MA Length', defval=50, minval=1, maxval=999, group='MA Settings')

//Other Moving Avarage Calculations
e1 = ta.ema(emaSource, emaLength)
e2 = ta.ema(e1, emaLength)
dema = 2 * e1 - e2

ema1 = ta.ema(emaSource, emaLength)
ema2 = ta.ema(ema1, emaLength)
ema3 = ta.ema(ema2, emaLength)
tema = 3 * (ema1 - ema2) + ema3

lsmaOffset = input.int(title="LSMA Offset", defval=0, minval=0, maxval=100, tooltip='Only used if you choose the LSMA and ZLSMA(Zero Lag LSMA) Option between MA Types', group='MA Settings')
lsma = ta.linreg(emaSource, emaLength, lsmaOffset)
lsma2 = ta.linreg(lsma, emaLength, lsmaOffset)
eq = lsma-lsma2
zlsma = lsma+eq

// Switch between different MA Types
emaValue = switch maType
    "EMA" => ta.ema(emaSource, emaLength)
    "SMA" => ta.sma(emaSource, emaLength)
    "WMA" => ta.wma(emaSource, emaLength)
    "VWMA" => ta.vwma(emaSource, emaLength)
    "HMA" => ta.hma(emaSource, emaLength)
    "RMA" => ta.rma(emaSource, emaLength)
    "DEMA" => dema
    "TEMA" => tema
    "LSMA" => lsma
    "ZLSMA" => zlsma
    =>
        runtime.error("No matching MA type found.")
        float(na)

//Define RSI inputs and group them
rsiSource = input.source(title='RSI Source', defval=close, group='RSI Settings')
rsiLength = input.int(title='RSI Length', defval=3, minval=0, maxval=100, group='RSI Settings')
rsiValuee = ta.rsi(rsiSource, rsiLength)
rsiOverbought = input.int(title='RSI Overbought Level', defval=80, group='RSI Settings')
rsiOversold = input.int(title='RSI Oversold Level', defval=20, group='RSI Settings')

//Define overbought and oversold conditions
isRsiOB = rsiValuee >= rsiOverbought
isRsiOS = rsiValuee <= rsiOversold

//ADX Inputs and calculation of the value
adxlen = input.int(5, title='ADX Smoothing', group='ADX Settings')
dilen = input.int(5, title='DI Length', group='ADX Settings')
dirmov(len) =>
    up = ta.change(high)
    down = -ta.change(low)
    plusDM = na(up) ? na : up > down and up > 0 ? up : 0
    minusDM = na(down) ? na : down > up and down > 0 ? down : 0
    truerange = ta.rma(ta.tr, len)
    plus = fixnan(100 * ta.rma(plusDM, len) / truerange)
    minus = fixnan(100 * ta.rma(minusDM, len) / truerange)
    [plus, minus]
adx(dilen, adxlen) =>
    [plus, minus] = dirmov(dilen)
    sum = plus + minus
    adx = 100 * ta.rma(math.abs(plus - minus) / (sum == 0 ? 1 : sum), adxlen)
    adx
sig = adx(dilen, adxlen)

//Define the input and value where it is considered that there is a trend going on
adxLimit = input.int(title='Trend Ready Limit', defval=30, minval=0, maxval=100, group='ADX Settings')
trendReady = sig > adxLimit

//Draw trend ready at the bottom of the chart for better viewing so that you can change the value based on what you see easier
plotADX = input(title='Draw Trend Ready On Chart', defval=false)
readyFold = plotADX and sig > adxLimit
plotchar(series=readyFold, title='Trend Ready', location=location.bottom, color=color.new(color.blue, 0), size=size.small, char='_')

//Plot the EMA on chart
enableEmaRule = input(title='Enable MA Rule', defval=true)

//Define the signal conditions and choice to add or leave out MA Rule if you wish so
alertLong = enableEmaRule ? low > emaValue and (rsiValuee <= rsiOversold or rsiValuee[1] <= rsiOversold or rsiValuee[2] <= rsiOversold) and sig > adxLimit and close > high[1] : (rsiValuee <= rsiOversold or rsiValuee[1] <= rsiOversold or rsiValuee[2] <= rsiOversold) and sig > adxLimit and close > high[1]
alertShort = enableEmaRule ? high < emaValue and (rsiValuee >= rsiOverbought or rsiValuee[1] >= rsiOverbought or rsiValuee[2] >= rsiOverbought) and sig > adxLimit and close < low[1] : (rsiValuee >= rsiOverbought or rsiValuee[1] >= rsiOverbought or rsiValuee[2] >= rsiOverbought) and sig > adxLimit and close < low[1]
plot(enableEmaRule ? emaValue : na, color=color.new(color.red, 0), title='MA')

//Buy and Sell Shapes on Chart
plotshape(alertLong, title='Buy', location=location.belowbar, color=color.new(color.green, 0), size=size.small, style=shape.triangleup, text='Buy')
plotshape(alertShort, title='Sell', location=location.abovebar, color=color.new(color.red, 0), size=size.small, style=shape.triangledown, text='Sell')

//Alerts
alertcondition(title='Buy Alert', condition=alertLong, message='Long Conditions are Met')
alertcondition(title='Sell Alert', condition=alertShort, message='Short Conditions are Met')
alertcondition(title='Buy / Sell Alert', condition=alertLong or alertShort, message='Conditions Met for Buy or Short')

if alertLong
    strategy.entry("Enter Long", strategy.long)
else if alertShort
    strategy.entry("Enter Short", strategy.short)
- Super Scalper - 5 Min 15 Min
- VWMA-ADX Momentum e Estratégia de longo prazo do Bitcoin baseada em tendências
- Oscilador Arco-íris
- SuperJump Volta para trás Banda de Bollinger
- A ESSMA
- Super Scalper
- MACD mais inteligente
- ZigZag baseado em momento
- Estratégia dinâmica de DCA baseada no volume
- Teoria da onda de Elliott 4-9 Detecção automática de onda de impulso Estratégia de negociação
- SAR alto SAR baixo
- SuperTREX
- Detector de pico
- Localizador baixo
- Tendência da SMA
- Baixos de Bollinger
- Super tendência B
- SIGNALES de comércio de balanço
- Ciclo de tendências de Schaff
- 72s: Média móvel do casco adaptativo +
- Divergência de volume
- Super Trend Daily 2.0 BF
- Hull Moving Average Swing Trader
- FTSMA - Trend é o teu amigo
- Filtro de faixa Comprar e vender
- Canal SSL
- Estratégia do Hull Suite
- Parabólica SAR Compra e Venda
- Maxima e Mínima baseadas em pivô
- Nick Rypock Trailing Reverse (NRTR)