Стохастический + RSI, двойная стратегия
Автор:Чао Чжан, Дата: 2022-05-25 16:12:14Тэги:СТОЧРСИ
Эта стратегия сочетает в себе классическую стратегию RSI - продавать, когда RSI увеличивается выше 70 (или покупать, когда он падает ниже 30), с классической стратегией Stochastic Slow - продавать, когда Stochastic oscillator превышает значение 80 (и покупать, когда это значение ниже 20).
Эта простая стратегия срабатывает только тогда, когда как RSI, так и Stochastic находятся вместе в состоянии перекупа или перепродажи.
Кстати, эту стратегию не следует путать с
Всякая торговля сопряжена с высоким риском; прошлые результаты не обязательно указывают на будущие результаты.
обратная проверка
/*backtest
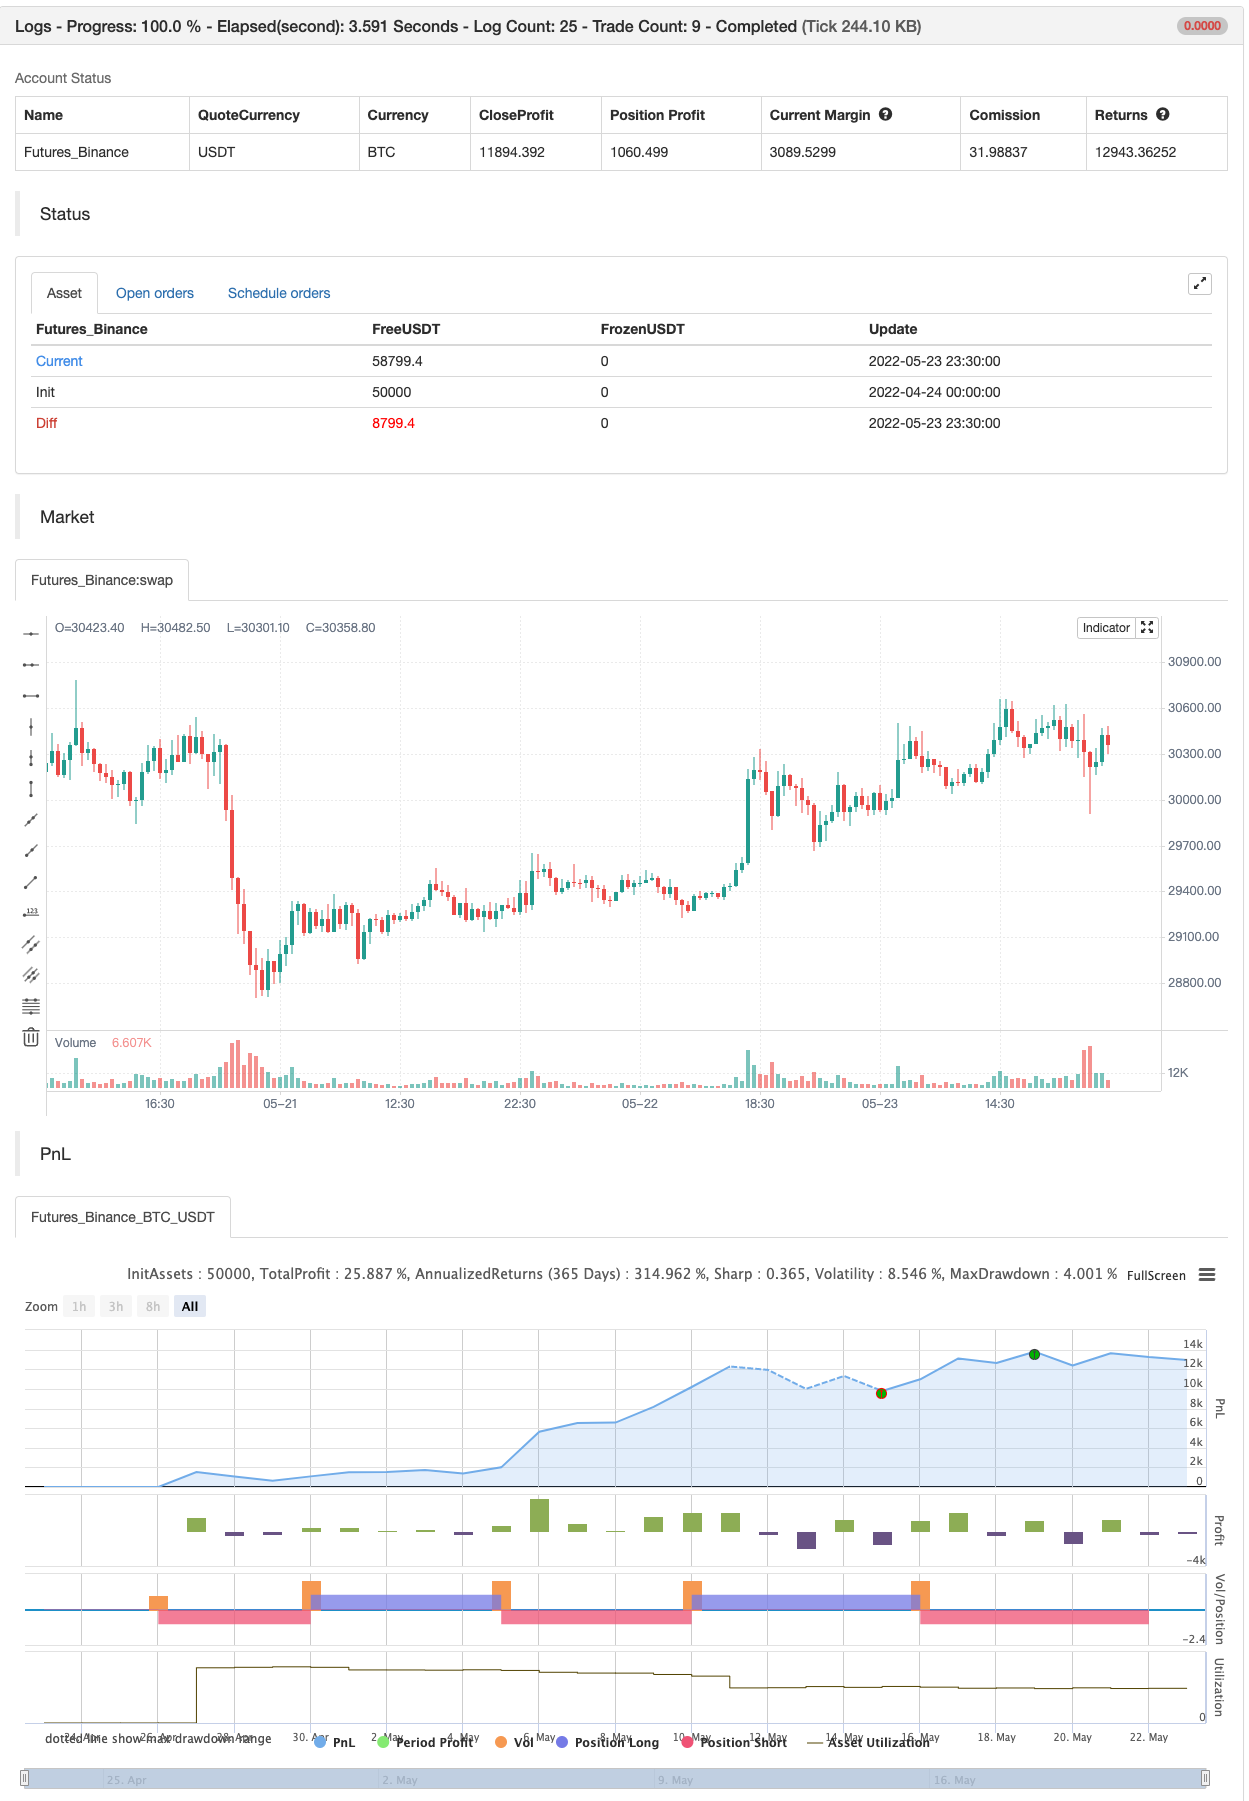
start: 2022-04-24 00:00:00
end: 2022-05-23 23:59:00
period: 30m
basePeriod: 15m
exchanges: [{"eid":"Futures_Binance","currency":"BTC_USDT"}]
*/
//@version=2
strategy("Stochastic + RSI, Double Strategy (by ChartArt)", shorttitle="CA_-_RSI_Stoch_Strat", overlay=true)
// ChartArt's Stochastic Slow + Relative Strength Index, Double Strategy
//
// Version 1.0
// Idea by ChartArt on October 23, 2015.
//
// This strategy combines the classic RSI
// strategy to sell when the RSI increases
// over 70 (or to buy when it falls below 30),
// with the classic Stochastic Slow strategy
// to sell when the Stochastic oscillator
// exceeds the value of 80 (and to buy when
// this value is below 20).
//
// This simple strategy only triggers when
// both the RSI and the Stochastic are together
// in overbought or oversold conditions.
//
// List of my work:
// https://www.tradingview.com/u/ChartArt/
///////////// Stochastic Slow
Stochlength = input(14, minval=1, title="lookback length of Stochastic")
StochOverBought = input(80, title="Stochastic overbought condition")
StochOverSold = input(20, title="Stochastic oversold condition")
smoothK = input(3, title="smoothing of Stochastic %K ")
smoothD = input(3, title="moving average of Stochastic %K")
k = sma(stoch(close, high, low, Stochlength), smoothK)
d = sma(k, smoothD)
///////////// RSI
RSIlength = input( 14, minval=1 , title="lookback length of RSI")
RSIOverBought = input( 70 , title="RSI overbought condition")
RSIOverSold = input( 30 , title="RSI oversold condition")
RSIprice = close
vrsi = rsi(RSIprice, RSIlength)
///////////// Double strategy: RSI strategy + Stochastic strategy
if (not na(k) and not na(d))
if (crossover(k,d) and k < StochOverSold)
if (not na(vrsi)) and (crossover(vrsi, RSIOverSold))
strategy.entry("LONG", strategy.long, comment="StochLE + RsiLE")
if (crossunder(k,d) and k > StochOverBought)
if (crossunder(vrsi, RSIOverBought))
strategy.entry("SHORT", strategy.short, comment="StochSE + RsiSE")
//plot(strategy.equity, title="equity", color=red, linewidth=2, style=areabr)
Связанные
- Стратегия покупки и продажи зависит от AO+Stoch+RSI+ATR
- Стратегия экстремального сигнала Bollinger Bands Stochastic RSI
- Экстремальная стратегия BBSR
- RSI - Сигналы покупки и продажи
- Статистические стратегии RSI
- РСИ МФО Ob+Os
- Стратегия индекса относительной силы RSI
- Супертрекс
- TMA-Legacy
- Болинджер + RSI, двойная стратегия v1.1
Больше
- Канал SSL
- Стратегия корпуса
- Параболическая SAR Купить и продать
- Максимальные и минимальные показатели на основе поворота
- Ник Райпок задним ходом (NRTR)
- ZigZag PA Стратегия V4.1
- Внутреннедневная покупка/продажа
- Кто-то сломал мечту - это ваша прибыль!
- Максимизатор прибыли PMax
- Безупречная стратегия победы
- Стратегия Swing Hull/rsi/EMA
- Инструмент торговли Swing Scalping R1-4
- Лучшая стратегия поглощения + вырыва
- Bollinger Awesome Alert R1 (Боллинджер Удивительный предупреждение R1)
- Многобиржевые плагины
- Треугольная сверлительная ставка (прибыль от дефицита цен на малые валюты)
- bybit обратно-контрактная динамическая сетка ((специфическая сетка))
- Уведомления по системе TradingView на MT4 MT5 + динамические переменные
- Матричная серия
- Супер скальпер - 5 минут 15 минут