Xem xét thị trường tiền kỹ thuật số năm 2021 và chiến lược đơn giản nhất 10 lần bỏ lỡ
Tác giả:Lydia., Tạo: 2022-10-26 16:12:49, Cập nhật: 2023-09-15 20:41:17
Tóm tắt cho năm 2021 và các chiến lược trong tương lai
Năm 2021 sắp kết thúc, và các điểm nóng từ DEFI đến GAMEFI đang nổi lên trong một dòng chảy vô tận, và thị trường nói chung vẫn là thị trường tăng trưởng. Bây giờ nhìn lại và tóm tắt, bạn đã đạt được bao nhiêu trong năm 2021? Bạn đã bỏ lỡ cơ hội nào? Một số khoản đầu tư thành công là gì? Gần đây, tôi đã xem xét thị trường lịch sử của năm qua và tìm thấy một chiến lược lợi nhuận đơn giản bất ngờ, đó là chỉ số đa tiền tệ.
Có rất nhiều loại tiền tệ trên sàn giao dịch, nhiều trong số đó được định mệnh là không được biết đến và thậm chí có thể bị rút khỏi giao dịch. Ở đây chúng tôi chọn loại tiền tệ của Binance vĩnh viễn đã được sử dụng trên thị trường. Chúng thường được kiểm tra và công nhận là các loại tiền tệ chính thống, tương đối an toàn. Sau khi sàng lọc đơn giản, một số loại tiền tệ chỉ số đã được loại bỏ và 134 loại tiền tệ cuối cùng đã được thu được.
Trong [1]:
import requests
from datetime import date,datetime
import time
import pandas as pd
import numpy as np
import matplotlib.pyplot as plt
%matplotlib inline
Trong [144]:
## Current trading pairs
Info = requests.get('https://fapi.binance.com/fapi/v1/exchangeInfo')
symbols = [s['symbol'] for s in Info.json()['symbols']]
Trong [154]:
symbols_f = list(set(filter(lambda x: x[-4:] == 'USDT', [s.split('_')[0] for s in symbols]))-
                 set(['1000SHIBUSDT','1000XECUSDT','BTCDOMUSDT','DEFIUSDT','BTCSTUSDT'])) + ['SHIBUSDT','XECUSDT']
print(symbols_f)
Trong [155]:
print(len(symbols_f))
Thị trường trong năm qua
Sau đó, chúng ta có được giá đóng cửa hàng ngày của họ trong năm qua, lưu ý rằng một số loại tiền tệ đã được trên kệ trong một khoảng thời gian ngắn, vì vậy chúng ta cần phải điền vào dữ liệu.
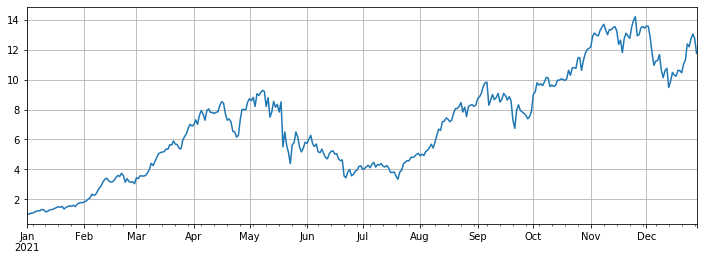
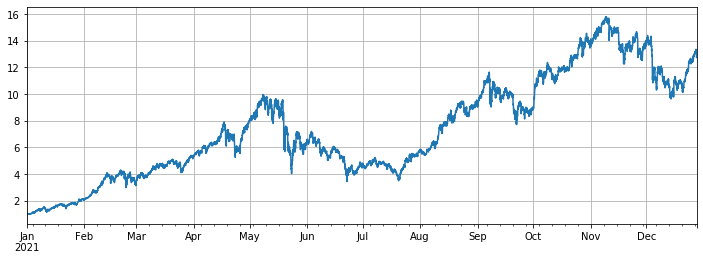
Trong khi đó, SOL, FTM, LUNA, MATIC, SAND và AXS đã tăng gần 100 lần. Trong số đó, AXS tăng 168 lần, làm cho nó trở thành con ngựa đen lớn nhất. Mức trung bình tăng 3 lần, chủ yếu là do chuỗi công cộng và trò chơi. Để loại bỏ sự thiên vị tồn tại, chúng tôi loại trừ đồng tiền mới vĩnh viễn trong giai đoạn này và chúng tôi cũng đạt được gần 11 lần lợi nhuận. Đó là 7 lần lợi nhuận cho BTC.
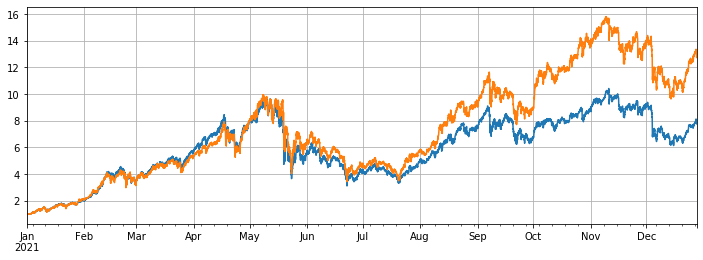
Đây là một tỷ lệ lợi nhuận tuyệt vọng. Tôi đã làm việc chăm chỉ để thực hiện tất cả các loại chiến lược, nhưng nó là xa so với lợi nhuận của việc không làm gì trong một năm. Tuy nhiên, cần lưu ý rằng một số tăng cụ thể là quá lớn và nó đã lệch khỏi chỉ số rõ ràng. Nếu các loại tiền tệ này không được chọn vào đầu năm, lợi nhuận sẽ gần trung bình, mà là ít có lợi nhuận hơn nhiều.
Trong [157]:
#Obtain the function of K-line in any period
def GetKlines(symbol='BTCUSDT',start='2020-8-10',end='2021-8-10',period='1h',base='fapi',v = 'v1'):
    Klines = []
    start_time = int(time.mktime(datetime.strptime(start, "%Y-%m-%d").timetuple()))*1000 + 8*60*60*1000
    end_time = int(time.mktime(datetime.strptime(end, "%Y-%m-%d").timetuple()))*1000 + 8*60*60*1000
    intervel_map = {'m':60*1000,'h':60*60*1000,'d':24*60*60*1000}
    while start_time < end_time:
        mid_time = min(start_time+1000*int(period[:-1])*intervel_map[period[-1]],end_time)
        url = 'https://'+base+'.binance.com/'+base+'/'+v+'/klines?symbol=%s&interval=%s&startTime=%s&endTime=%s&limit=1000'%(symbol,period,start_time,mid_time)
        res = requests.get(url)
        res_list = res.json()
        if type(res_list) == list and len(res_list) > 0:
            start_time = res_list[-1][0]
            Klines += res_list
        elif type(res_list) == list:
            start_time = start_time+1000*int(period[:-1])*intervel_map[period[-1]]
        else:
            break

    df = pd.DataFrame(Klines,columns=['time','open','high','low','close','amount','end_time','volume','count','buy_amount','buy_volume','null']).astype('float')
    df.index = pd.to_datetime(df.time,unit='ms')
    return df
Trong [164]:
df_all_s = pd.DataFrame(index=pd.date_range(start='2021-1-1', end='2021-12-28', freq='1d'),columns=symbols_s)
for i in range(len(symbols_f)):
    #print(symbols_s[i])
    symbol_s = symbols_f[i]
    df_s = GetKlines(symbol=symbol_s,start='2021-1-1',end='2021-12-28',period='1d',base='api',v='v3')
    df_all_s[symbol_s] = df_s[~df_s.index.duplicated(keep='first')].close
Trong [165]:
df_all_s.tail() #data structure
Ra khỏi [1]:
Trong [174]:
df_all = df_all_s.fillna(method='bfill')#filled data
df_norm = df_all/df_all.iloc[0] #normalization
df_norm.mean(axis=1).plot(figsize=(12,4),grid=True);
#The final index return chart
Ra khỏi [1]:
Trong [175]:
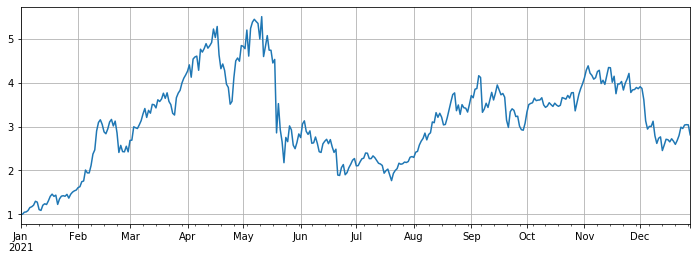
#The median increase
df_norm.median(axis=1).plot(figsize=(12,4),grid=True);
Ra khỏi [1]:
Trong [168]:
#Ranking for increase/decrease
print(df_norm.iloc[-1].round(2).sort_values().to_dict())
Trong [317]:
#Maximum rollback of current price compared with the highest point in the year
print((1-df_norm.iloc[-1]/df_norm.max()).round(2).sort_values().to_dict())
Trong [177]:
df_all_f = pd.DataFrame(index=pd.date_range(start='2021-1-1', end='2021-12-28', freq='1d'),columns=symbols_s)
for i in range(len(symbols_f)):
    #print(symbols_s[i])
    symbol_f = symbols_f[i]
    df_f = GetKlines(symbol=symbol_f,start='2021-1-1',end='2021-12-28',period='1d',base='fapi',v='v1')
    df_all_f[symbol_f] = df_f[~df_f.index.duplicated(keep='first')].close
Trong [208]:
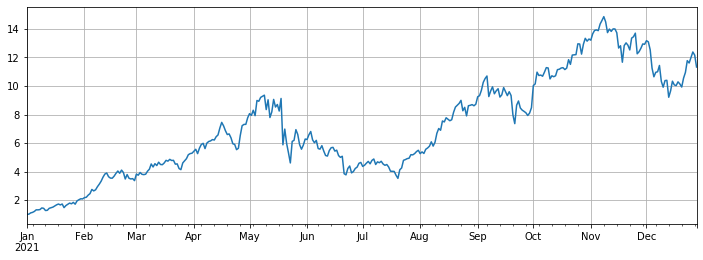
#Excluding new currency
df = df_all_s[df_all_s.columns[~df_all_f.iloc[0].isnull()]]
df = df.fillna(method='bfill')
df = df/df.iloc[0]
df.mean(axis=1).plot(figsize=(12,4),grid=True);
Ra khỏi[208]:
Trong [212]:
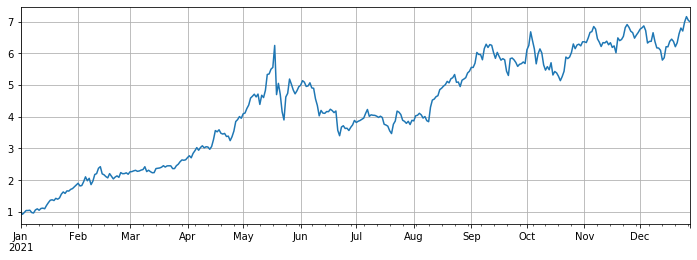
#Compared with Bitcoin
(df.mean(axis=1)/df.BTCUSDT).plot(figsize=(12,4),grid=True);
Ra khỏi [1]:
Trong [213]:
#Use the original backtest engine
class Exchange:

    def __init__(self, trade_symbols, fee=0.0004, initial_balance=10000):
        self.initial_balance = initial_balance #Initial assets
        self.fee = fee
        self.trade_symbols = trade_symbols
        self.account = {'USDT':{'realised_profit':0, 'unrealised_profit':0, 'total':initial_balance, 'fee':0}}
        for symbol in trade_symbols:
            self.account[symbol] = {'amount':0, 'hold_price':0, 'value':0, 'price':0, 'realised_profit':0,'unrealised_profit':0,'fee':0}

    def Trade(self, symbol, direction, price, amount):

        cover_amount = 0 if direction*self.account[symbol]['amount'] >=0 else min(abs(self.account[symbol]['amount']), amount)
        open_amount = amount - cover_amount
        self.account['USDT']['realised_profit'] -= price*amount*self.fee #Deduct the handling fee
        self.account['USDT']['fee'] += price*amount*self.fee
        self.account[symbol]['fee'] += price*amount*self.fee

        if cover_amount > 0: #Close the position first
            self.account['USDT']['realised_profit'] += -direction*(price - self.account[symbol]['hold_price'])*cover_amount  #Profits
            self.account[symbol]['realised_profit'] += -direction*(price - self.account[symbol]['hold_price'])*cover_amount

            self.account[symbol]['amount'] -= -direction*cover_amount
            self.account[symbol]['hold_price'] = 0 if self.account[symbol]['amount'] == 0 else self.account[symbol]['hold_price']

        if open_amount > 0:
            total_cost = self.account[symbol]['hold_price']*direction*self.account[symbol]['amount'] + price*open_amount
            total_amount = direction*self.account[symbol]['amount']+open_amount

            self.account[symbol]['hold_price'] = total_cost/total_amount
            self.account[symbol]['amount'] += direction*open_amount


    def Buy(self, symbol, price, amount):
        self.Trade(symbol, 1, price, amount)

    def Sell(self, symbol, price, amount):
        self.Trade(symbol, -1, price, amount)

    def Update(self, close_price): #Update the assets
        self.account['USDT']['unrealised_profit'] = 0
        for symbol in self.trade_symbols:
            self.account[symbol]['unrealised_profit'] = (close_price[symbol] - self.account[symbol]['hold_price'])*self.account[symbol]['amount']
            self.account[symbol]['price'] = close_price[symbol]
            self.account[symbol]['value'] = abs(self.account[symbol]['amount'])*close_price[symbol]
            self.account['USDT']['unrealised_profit'] += self.account[symbol]['unrealised_profit']
        self.account['USDT']['total'] = round(self.account['USDT']['realised_profit'] + self.initial_balance + self.account['USDT']['unrealised_profit'],6)
Trong [418]:
#The hourly K-line was taken to make the backtest more accurate
df_all_s = pd.DataFrame(index=pd.date_range(start='2021-1-1', end='2021-12-28', freq='1h'),columns=symbols_s)
for i in range(len(symbols_f)):
    #print(symbols_s[i])
    symbol_s = symbols_f[i]
    df_s = GetKlines(symbol=symbol_s,start='2021-1-1',end='2021-12-28',period='1h',base='api',v='v3')
    df_all_s[symbol_s] = df_s[~df_s.index.duplicated(keep='first')].close
Trong [419]:
df = df_all_s[df_all_s.columns[~df_all_f.iloc[0].isnull()]]
df = df.fillna(method='bfill')
df = df/df.iloc[0]
df.mean(axis=1).plot(figsize=(12,4),grid=True);
Ra khỏi [419]:
Hiệu suất của các chiến lược cân bằng
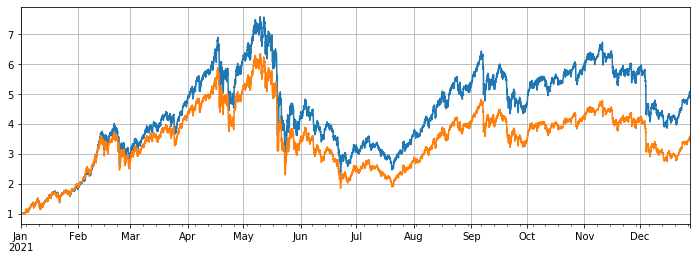
Trong thử nghiệm ngược, tất cả các loại tiền tệ của hợp đồng vĩnh cửu trực tuyến Binance vào ngày 1 tháng 1 năm 2021 đã được chọn. Thời gian K-line là 1h. Các thông số bắt đầu mở rộng quy mô trong các vị trí khi vị trí thấp hơn 5% so với mức trung bình, và bán chúng khi vị trí cao hơn 5%. Khi thử nghiệm ngược là tất cả các loại tiền tệ, lợi nhuận chiến lược cuối cùng là 7,7 lần. Rõ ràng không tốt như lợi nhuận trung bình 13 lần. Điều này cũng được mong đợi. Sau tất cả, một số loại tiền tệ tăng một trăm lần là quá đặc biệt, và chiến lược cân bằng sẽ bán tất cả chúng.
Nếu loại bỏ 10 loại tiền tệ tăng cao nhất khỏi backtest, chỉ có các loại tiền tệ tương đối tầm thường sẽ được xem xét, và thu nhập cuối cùng sẽ là 4,8 lần, vượt xa so với hiệu suất trung bình 3,4 lần.
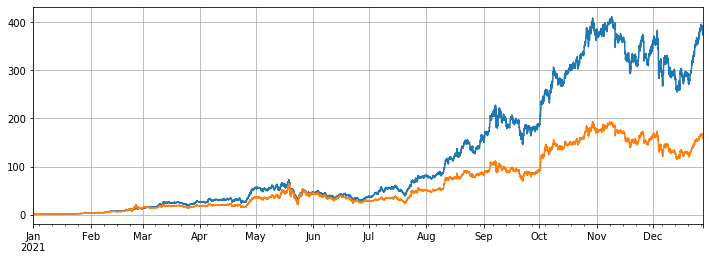
Nếu chỉ có 3 đồng tiền tăng cao nhất được xoay, lợi nhuận cuối cùng sẽ là 373 lần, cao hơn nhiều so với hiệu suất trung bình 160 lần. Điều này cho thấy rằng nếu xu hướng và tăng của đồng tiền xoay được chọn có xu hướng nhất quán, kết quả xoay sẽ tốt hơn nhiều so với không làm gì cả.
Trong [494]:
#Full currency backtest
symbols = list(df.iloc[-1].sort_values()[:].index)
e = Exchange(symbols, fee=0.001, initial_balance=10000)
res_list = []
avg_pct = 1/len(symbols)
for row in df[symbols].iterrows():
    prices = row[1]
    total = e.account['USDT']['total']
    e.Update(prices)
    for symbol in symbols:
        pct = e.account[symbol]['value']/total
        if pct < 0.95*avg_pct:
            e.Buy(symbol,prices[symbol],(avg_pct-pct)*total/prices[symbol])
        if pct > 1.05*avg_pct:
            e.Sell(symbol,prices[symbol],(pct-avg_pct)*total/prices[symbol])
    res_list.append([e.account[symbol]['value'] for symbol in symbols] + [e.account['USDT']['total']])
res = pd.DataFrame(data=res_list, columns=symbols+['total'],index = df.index)
Trong [495]:
e.account['USDT']
Ngoài[495]:
Trong [496]:
# Backtest performance of full currencies
(res.total/10000).plot(figsize=(12,4),grid = True);
df[symbols].mean(axis=1).plot(figsize=(12,4),grid=True);
Ra khỏi[496]:
Trong [498]:
#Remove currencies with huge growth
symbols = list(df.iloc[-1].sort_values()[:-10].index)
e = Exchange(symbols, fee=0.001, initial_balance=10000)
res_list = []
avg_pct = 1/len(symbols)
for row in df[symbols].iterrows():
    prices = row[1]
    total = e.account['USDT']['total']
    e.Update(prices)
    for symbol in symbols:
        pct = e.account[symbol]['value']/total
        if pct < 0.95*avg_pct:
            e.Buy(symbol,prices[symbol],(avg_pct-pct)*total/prices[symbol])
        if pct > 1.05*avg_pct:
            e.Sell(symbol,prices[symbol],(pct-avg_pct)*total/prices[symbol])
    res_list.append([e.account[symbol]['value'] for symbol in symbols] + [e.account['USDT']['total']])
res = pd.DataFrame(data=res_list, columns=symbols+['total'],index = df.index)
Trong [501]:
e.account['USDT']
Ra khỏi[501]:
Trong [499]:
(res.total/10000).plot(figsize=(12,4),grid = True);
df[symbols].mean(axis=1).plot(figsize=(12,4),grid=True);
Ra khỏi [499]:
Trong [503]:
#Only the currency with the highest increase is tested
symbols = list(df.iloc[-1].sort_values()[-3:].index)
e = Exchange(symbols, fee=0.001, initial_balance=10000)
res_list = []
avg_pct = 1/len(symbols)
for row in df[symbols].iterrows():
    prices = row[1]
    total = e.account['USDT']['total']
    e.Update(prices)
    for symbol in symbols:
        pct = e.account[symbol]['value']/total
        if pct < 0.95*avg_pct:
            e.Buy(symbol,prices[symbol],(avg_pct-pct)*total/prices[symbol])
        if pct > 1.05*avg_pct:
            e.Sell(symbol,prices[symbol],(pct-avg_pct)*total/prices[symbol])
    res_list.append([e.account[symbol]['value'] for symbol in symbols] + [e.account['USDT']['total']])
res = pd.DataFrame(data=res_list, columns=symbols+['total'],index = df.index)
Trong [504]:
e.account['USDT']
Ra khỏi[504]:
Trong [505]:
(res.total/10000).plot(figsize=(12,4),grid = True);
df[symbols].mean(axis=1).plot(figsize=(12,4),grid=True);
Ngoài[505]:
Tóm lại
Nói chung, năm 2021 sẽ là một thị trường tăng giá cho các đồng tiền giả và một năm giảm giá cho Bitcoin. Giá trị thị trường của Bitcoin đã giảm xuống còn 40% hiện nay từ 70% vào đầu năm, đây là mức thấp nhất trong lịch sử. Do đó, lợi nhuận trung bình từ việc mua và giữ hàng giả trong năm qua cao hơn nhiều so với việc giữ Bitcoin. Nhìn về phía trước vào năm 2022, nếu bạn cho rằng vẫn sẽ có nhiều loại tiền tệ hàng trăm lần trong thị trường hiện tại trong tương lai, bạn có thể đa dạng hóa các vị trí của mình một cách táo bạo và kiên nhẫn chờ đợi. Nếu bạn đặc biệt lạc quan về một vài loại tiền tệ hoặc thị trường trung bình, bạn có thể sử dụng chiến lược xoay để có lợi nhuận dư thừa mà không suy nghĩ. Nếu bạn nghĩ rằng mọi thứ sẽ đạt đến nhau khi chúng trở nên cực đoan, bạn có thể mặc cả săn Bitcoin để có được lợi nhuận và an ninh tốt hơn.
- Xác định số lượng phân tích cơ bản trong thị trường tiền điện tử: Hãy để dữ liệu nói cho chính nó!
- Các nghiên cứu định lượng cơ bản của vòng đồng tiền - đừng tin vào những giáo viên mờ nhạt, nói khách quan về dữ liệu!
- Một công cụ thiết yếu trong lĩnh vực giao dịch định lượng - nhà phát minh mô-đun khám phá dữ liệu định lượng
- Kiểm soát mọi thứ - giới thiệu về FMZ Phiên bản mới của Terminal giao dịch (với mã nguồn TRB Arbitrage)
- Có tất cả các thông tin về FMZ phiên bản mới của giao dịch đầu cuối (được thêm mã nguồn TRB)
- FMZ Quant: Phân tích các ví dụ thiết kế yêu cầu chung trong thị trường tiền điện tử (II)
- Làm thế nào để khai thác robot bán hàng không có não với một chiến lược tần số cao trong 80 dòng mã
- FMZ định lượng: Phân tích các trường hợp thiết kế nhu cầu phổ biến của thị trường tiền điện tử (II)
- Cách khai thác robot vô trí tuệ để bán bằng chiến lược tần số cao 80 dòng mã
- FMZ Quant: Phân tích các ví dụ thiết kế yêu cầu chung trong thị trường tiền điện tử (I)
- FMZ định lượng: Các nhu cầu phổ biến của thị trường tiền điện tử