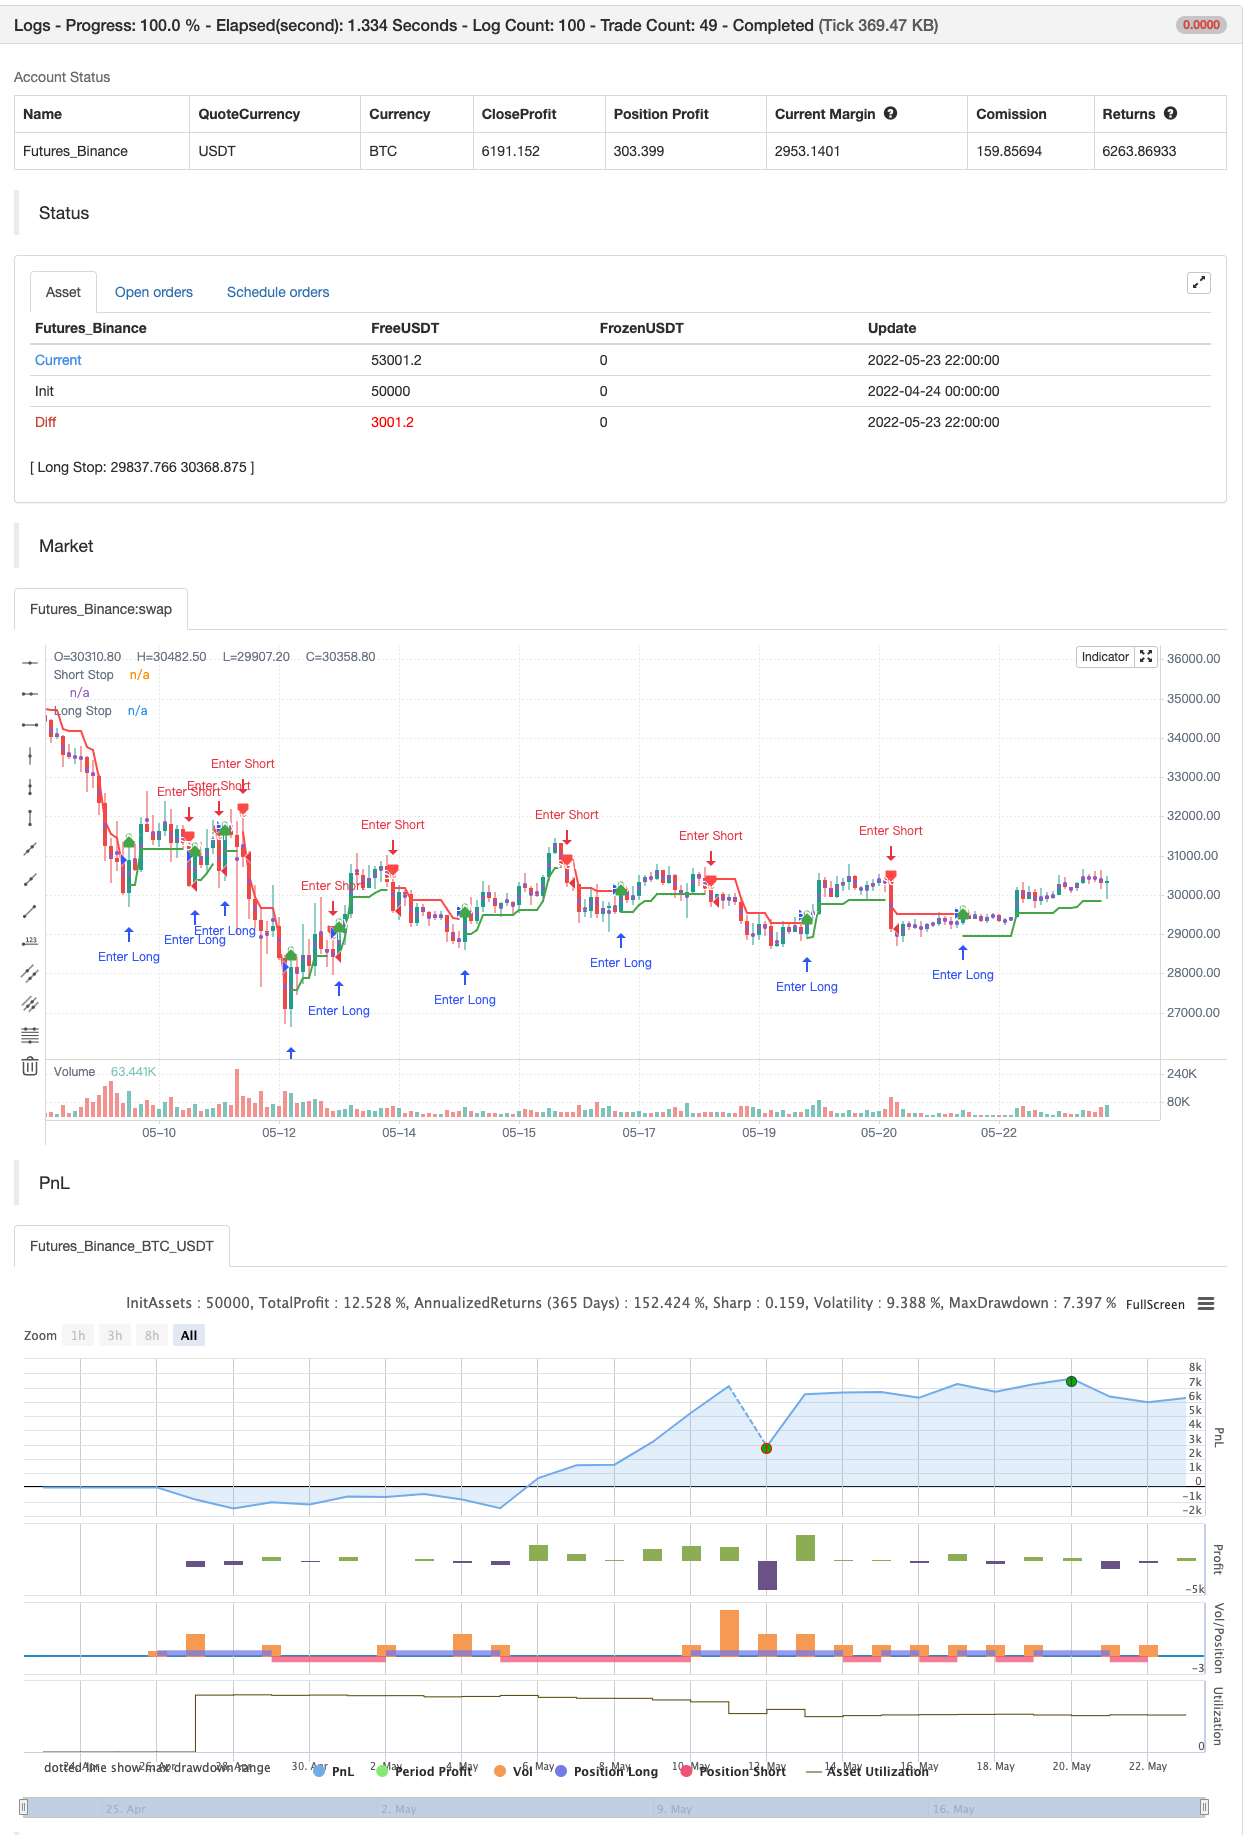
Nick Rypock Lái ngược (NRTR)
Tác giả:ChaoZhang, Ngày: 2022-05-25 18:14:32Tags:NRTR
Chỉ số này được phát minh vào năm 2001 bởi Konstantin Kopyrkin.
Kopyrkin -> Kopyr Kin -> Kin Kopyr -> Nik Rypok
Ý tưởng của chỉ số tương tự như Chandelier Exit, nhưng không liên quan đến thành phần ATR và thay vào đó sử dụng tỷ lệ phần trăm.
Một kênh giá năng động được sử dụng để tính NRTR. Các tính toán chỉ liên quan đến những giá được bao gồm trong xu hướng hiện tại và loại trừ các mức cực liên quan đến xu hướng trước. Chỉ số luôn ở cùng một khoảng cách (trong phần trăm) so với mức cực đạt được bởi giá (dưới đỉnh tối đa cho xu hướng tăng hiện tại, trên đáy tối thiểu cho xu hướng giảm hiện tại).
backtest

/*backtest
start: 2022-04-24 00:00:00
end: 2022-05-23 23:59:00
period: 2h
basePeriod: 15m
exchanges: [{"eid":"Futures_Binance","currency":"BTC_USDT"}]
*/

//@version=4
// Copyright (c) 2021-present, Alex Orekhov (everget)
study("Nick Rypock Trailing Reverse", shorttitle="NRTR", overlay=true)

k = input(title="Coefficient of Correction, %", type=input.float, minval=0, maxval=100, step=0.1, defval=2)
showLabels = input(title="Show Buy/Sell Labels ?", type=input.bool, defval=true)
applyRibbon = input(title="Apply Ribbon ?", type=input.bool, defval=true)

var int trend = 0
var float hp = close
var float lp = close
float nrtr = close

percentage = k * 0.01

if trend >= 0
	if close > hp
		hp := close
		hp
	nrtr := hp * (1 - percentage)
	if close <= nrtr
		trend := -1
		lp := close
		nrtr := lp * (1 + percentage)
		nrtr
else
	if close < lp
		lp := close
		lp
	nrtr := lp * (1 + percentage)
	if close > nrtr
		trend := 1
		hp := close
		nrtr := hp * (1 - percentage)
		nrtr

var color longColor = color.green
var color shortColor = color.red
var color textColor = color.white

longStopPlot = plot(trend == 1 ? nrtr : na, title="Long Stop", style=plot.style_linebr, linewidth=2, color=longColor)
buySignal = trend == 1 and trend[1] == -1
plotshape(buySignal ? nrtr : na, title="Long Stop Start", location=location.absolute, style=shape.circle, size=size.tiny, color=longColor, transp=0)
plotshape(buySignal and showLabels ? nrtr : na, title="Buy Label", text="Buy", location=location.absolute, style=shape.labelup, size=size.tiny, color=longColor, textcolor=textColor, transp=0)

shortStopPlot = plot(trend == 1 ? na : nrtr, title="Short Stop", style=plot.style_linebr, linewidth=2, color=shortColor)
sellSignal = trend == -1 and trend[1] == 1
plotshape(sellSignal ? nrtr : na, title="Short Stop Start", location=location.absolute, style=shape.circle, size=size.tiny, color=shortColor, transp=0)
plotshape(sellSignal and showLabels ? nrtr : na, title="Sell Label", text="Sell", location=location.absolute, style=shape.labeldown, size=size.tiny, color=shortColor, textcolor=textColor, transp=0)

midPricePlot = plot(ohlc4, title="", style=plot.style_circles, linewidth=0, display=display.none, editable=false)

longFillColor = applyRibbon ? (trend == 1 ? longColor : na) : na
shortFillColor = applyRibbon ? (trend == -1 ? shortColor : na) : na
fill(midPricePlot, longStopPlot, title="Long Ribbon", color=longFillColor)
fill(midPricePlot, shortStopPlot, title="Short Ribbon", color=shortFillColor)

changeCond = trend != trend[1]
alertcondition(changeCond, title="Alert: NRTR Direction Change", message="NRTR has changed direction!")
alertcondition(buySignal, title="Alert: NRTR Buy", message="NRTR Buy!")
alertcondition(sellSignal, title="Alert: NRTR Sell", message="NRTR Sell!")


if buySignal
    strategy.entry("Enter Long", strategy.long)
else if sellSignal
    strategy.entry("Enter Short", strategy.short)
Có liên quan
Thêm nữa
- Scalping EMA ADX RSI với Buy/Sell
- Sự khác biệt về khối lượng
- Super Trend Daily 2.0 BF
- Hull Moving Average Swing Trader
- FTSMA - Trend là bạn của bạn
- Range Filter Mua và bán
- Kênh SSL
- Chiến lược Hull Suite
- SAR Parabolic Mua và bán
- Tiêu chí tối đa và tối thiểu dựa trên pivot
- ZigZag PA Chiến lược V4.1
- Mua/Bán trong ngày
- Phân đoạn bị phá vỡ: giấc mơ bị phá vỡ của ai đó là lợi nhuận của bạn!
- Tối đa hóa lợi nhuận PMax
- Chiến lược chiến thắng hoàn hảo
- Stochastic + RSI, Chiến lược đôi
- Chiến lược Swing Hull/rsi/EMA
- Scalping Swing Trading Tool R1-4
- Chiến lược ngập + thoát tốt nhất
- Bollinger Awesome Alert R1