FTSMA - Trend là bạn của bạn
Tác giả:ChaoZhang, Ngày: 2022-05-26 15:49:22Tags:EMASMARMA
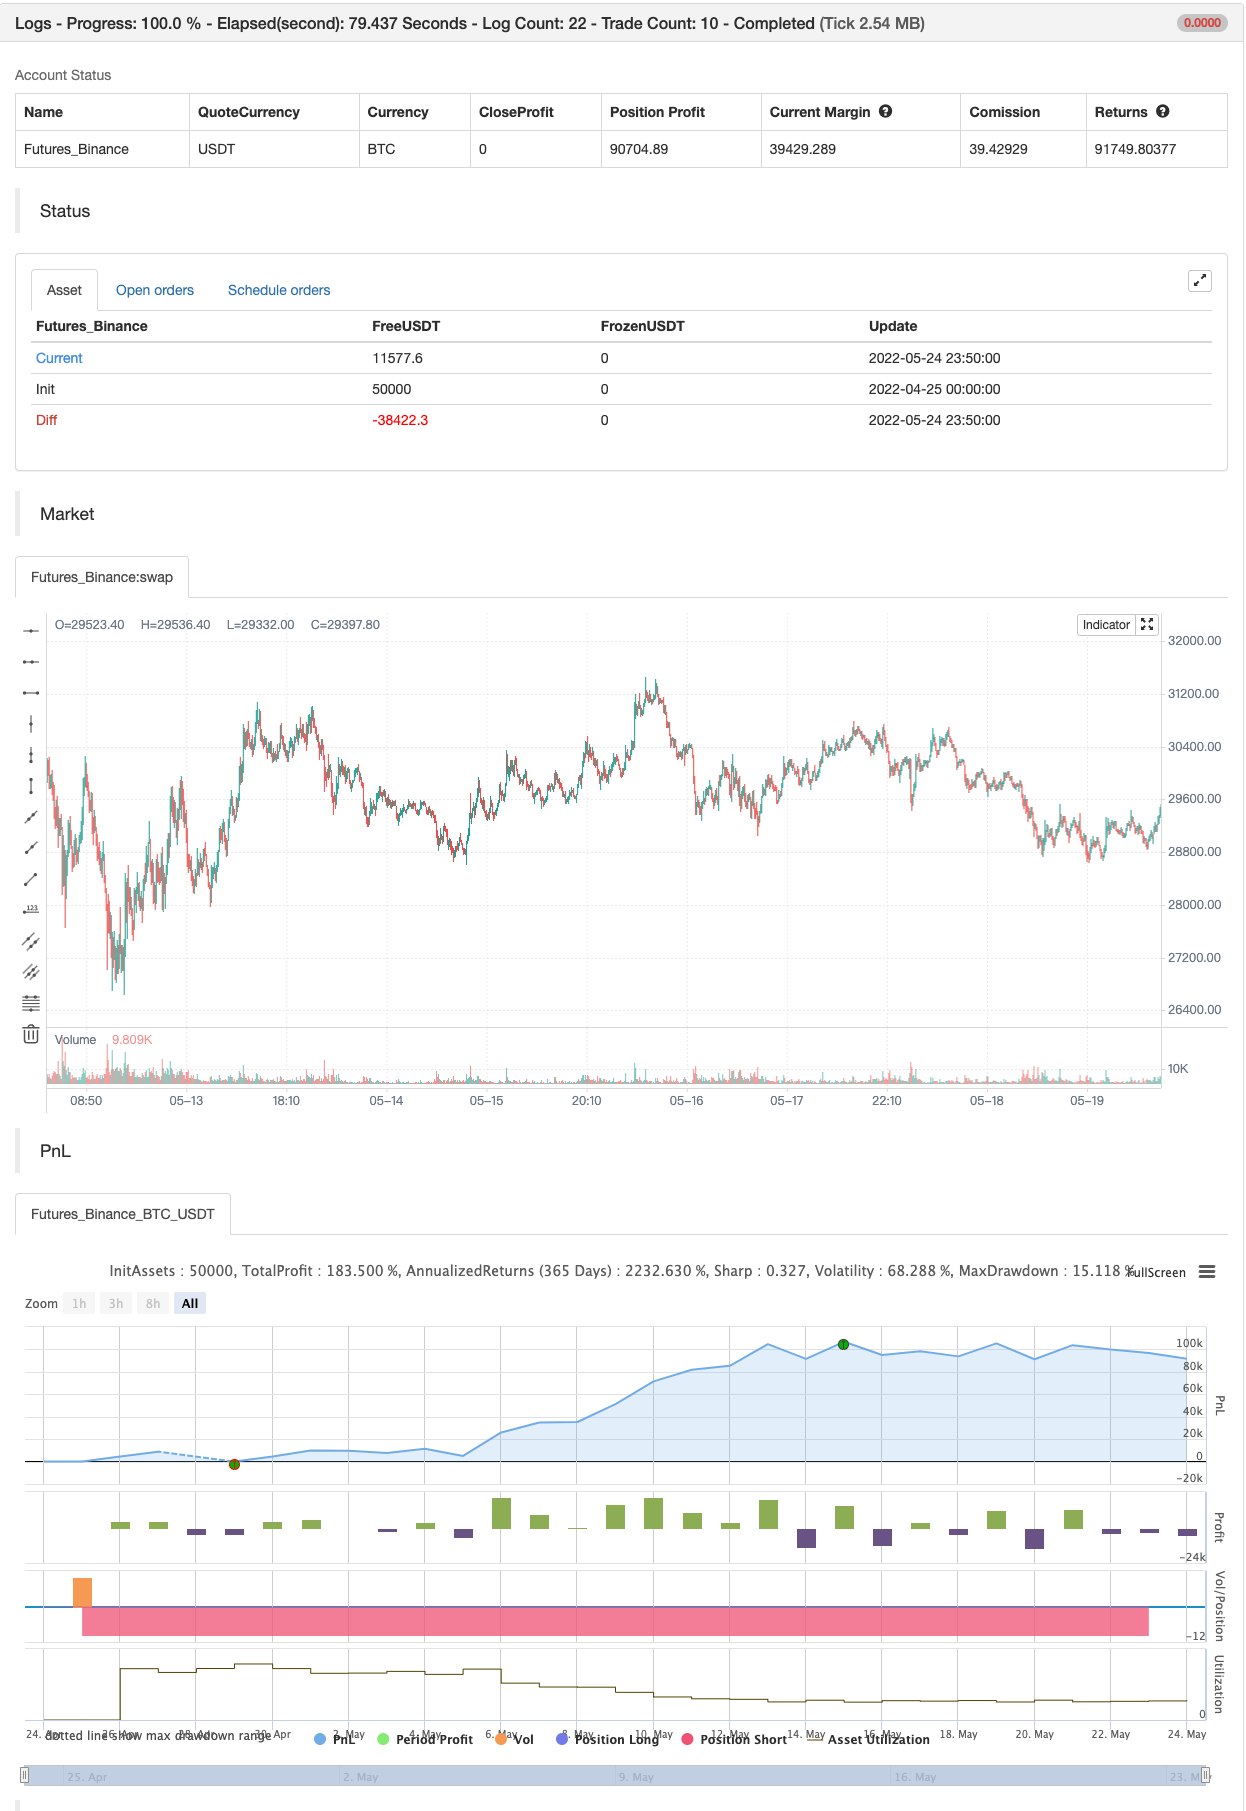
Đây là chiến lược vững chắc mới của tôi: nếu bạn tin rằng
Tôi đã thử nghiệm với nhiều cặp và trong nhiều khung thời gian và có lợi nhuận chỉ với những thay đổi nhỏ trong cài đặt. Tôi đề nghị sử dụng nó để giao dịch trong ngày.
Lưu ý rất quan trọng: đây là một chiến lược theo xu hướng, vì vậy mục tiêu là ở lại trong giao dịch càng nhiều càng tốt.
Chiến lược này sử dụng các đường trung bình động áp dụng cho sóng Fourier để dự đoán hướng xu hướng.
Chiến lược hoạt động như thế nào:
- Mua khi MA nhanh ở trên MA trung bình và giá ở trên MA chậm, hoạt động như một chỉ số xu hướng.
- Bán khi MA nhanh dưới mức MA trung bình và giá dưới MA chậm, hoạt động như một chỉ số xu hướng.
Chiến lược sử dụng rất nhiều lệnh kim tự tháp bởi vì khi bạn ở trong một giai đoạn thị trường phẳng nó sẽ đóng 1 hoặc 2 lệnh với lỗ, nhưng khi một xu hướng lớn bắt đầu, nó sẽ có lợi nhuận trong rất nhiều lệnh.
Vì vậy, nếu bạn phân tích cẩn thận các kết quả chiến lược, bạn sẽ nhận thấy rằng
Cảm ơn tất cả các pinescripters được đề cập trong mã cho đoạn trích của họ.
Tôi cũng có một nghiên cứu với cảnh báo. cải tiến tiếp theo (chỉ cho những người quan tâm đến kịch bản này và theo tôi): nghiên cứu với cảnh báo trên nhiều ticker tất cả cùng một lúc.
Làm thế nào để sử dụng chiến lược và nghiên cứu cùng nhau: 1- Thêm vào biểu đồ chiến lược trước, để không gian làm việc của bạn sẽ sạch sẽ nhất có thể. 2- Mở tab Strategy Tester ở chân trang. 3- Thay đổi cài đặt để có được kết quả tốt nhất (Lợi nhuận, yếu tố lợi nhuận, rút tiền). 4- Thêm nghiên cứu với cảnh báo vào biểu đồ của bạn với cùng một thiết lập chiến lược. Tôi sẽ cung cấp một hướng dẫn cài đặt nhanh chi tiết cùng với các nghiên cứu!
backtest
/*backtest
start: 2022-04-25 00:00:00
end: 2022-05-24 23:59:00
period: 10m
basePeriod: 1m
exchanges: [{"eid":"Futures_Binance","currency":"BTC_USDT"}]
*/

// This source code is subject to the terms of the Mozilla Public License 2.0 at https://mozilla.org/MPL/2.0/
// © 03.freeman

//@version=4
strategy("FTSMA", overlay=true, precision=6, initial_capital=10000,calc_on_every_tick=true, pyramiding=10, default_qty_type=strategy.fixed, default_qty_value=10000, currency=currency.EUR)
src=input(close,"Source")
slowMA=input(200,"Slow MA period")
mediumMA=input(20,"Mid MA period")
fastMA=input(5,"Fast MA period")
plotSMA=input(true,"Use MA")
sin1=input(1,"First sinusoid",minval=1)
sin2=input(2,"Second sinusoid",minval=1)
sin3=input(3,"Third sinusoid",minval=1)
smoothinput = input('EMA', title = "MA Type", options =['EMA', 'SMA', 'ALMA','FRAMA','RMA', 'SWMA', 'VWMA','WMA','LinearRegression'])
linearReg=input(false, "Use linear regression?")
linregLenght=input(13, "Linear regression lenght")
linregOffset=input(0, "Linear regression offset")

//------FRAMA ma---------
ma(src, len) =>
    float result = 0
    int len1 = len/2
    frama_SC=200
    frama_FC=1
    e = 2.7182818284590452353602874713527
    w = log(2/(frama_SC+1)) / log(e) // Natural logarithm (ln(2/(SC+1))) workaround
    H1 = highest(high,len1)
    L1 = lowest(low,len1)
    N1 = (H1-L1)/len1
    H2_ = highest(high,len1)
    H2 = H2_[len1]
    L2_ = lowest(low,len1)
    L2 = L2_[len1]
    N2 = (H2-L2)/len1
    H3 = highest(high,len)
    L3 = lowest(low,len)
    N3 = (H3-L3)/len
    dimen1 = (log(N1+N2)-log(N3))/log(2)
    dimen = iff(N1>0 and N2>0 and N3>0,dimen1,nz(dimen1[1]))
    alpha1 = exp(w*(dimen-1))
    oldalpha = alpha1>1?1:(alpha1<0.01?0.01:alpha1)
    oldN = (2-oldalpha)/oldalpha
    N = (((frama_SC-frama_FC)*(oldN-1))/(frama_SC-1))+frama_FC
    alpha_ = 2/(N+1)
    alpha = alpha_<2/(frama_SC+1)?2/(frama_SC+1):(alpha_>1?1:alpha_)
    frama = 0.0
    frama :=(1-alpha)*nz(frama[1]) + alpha*src
    result := frama
    result

// ----------MA calculation - ChartArt and modified by 03.freeman-------------
calc_ma(src,l) =>
    _ma = smoothinput=='SMA'?sma(src, l):smoothinput=='EMA'?ema(src, l):smoothinput=='WMA'?wma(src, l):smoothinput=='LinearRegression'?linreg(src, l,0):smoothinput=='VWMA'?vwma(src,l):smoothinput=='RMA'?rma(src, l):smoothinput=='ALMA'?alma(src,l,0.85,6):smoothinput=='SWMA'?swma(src):smoothinput=='FRAMA'?ma(sma(src,1),l):na

//----------------------------------------------


//pi = acos(-1)
// Approximation of Pi in _n terms --- thanks to e2e4mfck
f_pi(_n) =>
    _a = 1. / (4. * _n + 2)
    _b = 1. / (6. * _n + 3)
    _pi = 0.
    for _i = _n - 1 to 0
        _a := 1 / (4. * _i + 2) - _a / 4.
        _b := 1 / (6. * _i + 3) - _b / 9.
    _pi := (4. * _a) + (4. * _b) - _pi
pi=f_pi(20)

//---Thanks to xyse----https://www.tradingview.com/script/UTPOoabQ-Low-Frequency-Fourier-Transform/
//Declaration of user-defined variables
N = input(defval=64, title="Lookback Period", type=input.integer, minval=2, maxval=600, confirm=false, step=1, options=[2,4,8,16,32,64,128,256,512,1024,2048,4096])

//Real part of the Frequency Domain Representation
ReX(k) =>
    sum = 0.0
    for i=0 to N-1
        sum := sum + src[i]*cos(2*pi*k*i/N)
    return = sum

//Imaginary part of the Frequency Domain Representation
ImX(k) =>
    sum = 0.0
    for i=0 to N-1
        sum := sum + src[i]*sin(2*pi*k*i/N)
    return = -sum

//Get sinusoidal amplitude from frequency domain
ReX_(k) =>
    case = 0.0
    if(k!=0 and k!=N/2)
        case := 2*ReX(k)/N
    if(k==0)
        case := ReX(k)/N
    if(k==N/2)
        case := ReX(k)/N
    return = case

 //Get sinusoidal amplitude from frequency domain
ImX_(k) =>
    return = -2*ImX(k)/N

//Get full Fourier Transform
x(i, N) =>
    sum1 = 0.0
    sum2 = 0.0
    for k=0 to N/2
        sum1 := sum1 + ReX_(k)*cos(2*pi*k*i/N)
    for k=0 to N/2
        sum2 := sum2 + ImX_(k)*sin(2*pi*k*i/N)
    return = sum1+sum2

//Get single constituent sinusoid
sx(i, k) =>
    sum1 = ReX_(k)*cos(2*pi*k*i/N)
    sum2 = ImX_(k)*sin(2*pi*k*i/N)
    return = sum1+sum2
//Calculations for strategy
SLOWMA = plotSMA?calc_ma(close+sx(0,sin1),slowMA):close+sx(0,sin1)
MEDMA = plotSMA?calc_ma(close+sx(0,sin2),mediumMA):close+sx(0,sin2)
FASTMA = plotSMA?calc_ma(close+sx(0,sin3),fastMA):close+sx(0,sin3)

SLOWMA := linearReg?linreg(SLOWMA,linregLenght,linregOffset):SLOWMA
MEDMA := linearReg?linreg(MEDMA,linregLenght,linregOffset):MEDMA
FASTMA := linearReg?linreg(FASTMA,linregLenght,linregOffset):FASTMA

//Plot 3 Low-Freq Sinusoids
plot(SLOWMA, color=color.green)
plot(MEDMA, color=color.red)
plot(FASTMA, color=color.blue)

//  Strategy: (Thanks to JayRogers)
// === STRATEGY RELATED INPUTS ===
// the risk management inputs
inpTakeProfit   = input(defval = 0, title = "Take Profit Points", minval = 0)
inpStopLoss     = input(defval = 0, title = "Stop Loss Points", minval = 0)
inpTrailStop    = input(defval = 0, title = "Trailing Stop Loss Points", minval = 0)
inpTrailOffset  = input(defval = 0, title = "Trailing Stop Loss Offset Points", minval = 0)

// === RISK MANAGEMENT VALUE PREP ===
// if an input is less than 1, assuming not wanted so we assign 'na' value to disable it.
useTakeProfit   = inpTakeProfit  >= 1 ? inpTakeProfit  : na
useStopLoss     = inpStopLoss    >= 1 ? inpStopLoss    : na
useTrailStop    = inpTrailStop   >= 1 ? inpTrailStop   : na
useTrailOffset  = inpTrailOffset >= 1 ? inpTrailOffset : na

longCondition = FASTMA>MEDMA and close > SLOWMA             //crossover(FASTMA, MEDMA) and close > SLOWMA
if (longCondition)
    strategy.entry("Long Entry", strategy.long)

shortCondition = FASTMA<MEDMA and close < SLOWMA            //crossunder(FASTMA, MEDMA) and close < SLOWMA
if (shortCondition)
    strategy.entry("Short Entry", strategy.short)

// === STRATEGY RISK MANAGEMENT EXECUTION ===
// finally, make use of all the earlier values we got prepped
strategy.exit("Exit Buy", from_entry = "Long Entry", profit = useTakeProfit, loss = useStopLoss, trail_points = useTrailStop, trail_offset = useTrailOffset)
strategy.exit("Exit Sell", from_entry = "Short Entry", profit = useTakeProfit, loss = useStopLoss, trail_points = useTrailStop, trail_offset = useTrailOffset)
- MA HYBRID BY RAJ
- SSL lai
- Rainbow Oscillator
- Mô hình cảnh báo phóng mặt trăng [Dấu hiệu]
- SuperJump quay lại Bollinger Band
- Super Scalper
- ESSMA
- MACD thông minh hơn
- Super Scalper - 5 phút 15 phút
- Scalping EMA ADX RSI với Buy/Sell
- Xu hướng SMA
- Bollinger Lows
- siêu xu hướng B
- SIGNAL TRADING SWING
- Chu kỳ xu hướng Schaff
- 72s: Đường trung bình chuyển động thân xe thích nghi +
- Scalping EMA ADX RSI với Buy/Sell
- Sự khác biệt về khối lượng
- Super Trend Daily 2.0 BF
- Hull Moving Average Swing Trader
- Range Filter Mua và bán
- Kênh SSL
- Chiến lược Hull Suite
- SAR Parabolic Mua và bán
- Tiêu chí tối đa và tối thiểu dựa trên pivot
- Nick Rypock Lái ngược (NRTR)
- ZigZag PA Chiến lược V4.1
- Mua/Bán trong ngày
- Phân đoạn bị phá vỡ: giấc mơ bị phá vỡ của ai đó là lợi nhuận của bạn!
- Tối đa hóa lợi nhuận PMax