Scalping EMA ADX RSI với Buy/Sell
Tác giả:ChaoZhang, Ngày: 2022-05-26 17:11:01Tags:ADXRMARSIEMASMAWMA
Đây là một chỉ số nghiên cứu cho thấy các mục trong chiến lược được nhìn thấy trong một trong các kênh youtube vì vậy nó không thuộc về tôi. Tôi không thể nói đó là ai vì nó là chống lại các quy tắc nhà để quảng cáo nhưng bạn có thể tìm hiểu nếu bạn tìm kiếm nó trên youtube. Giá trị mặc định của dao động và ema điều chỉnh như đề xuất. Ông nói rằng ông đã có kết quả tốt nhất trong khung thời gian 5 phút nhưng tôi đã cố gắng làm cho mọi thứ thay đổi càng tốt càng tốt để bạn có thể chơi xung quanh với các thiết lập và tạo chiến lược của riêng bạn cho các khung thời gian khác nhau nếu bạn muốn.
Chính chiến lược nhập cảnh là khá đơn giản. Các quy tắc để nhập là như sau, các kịch bản sẽ kiểm tra tất cả các điều này trên tự động và sẽ cung cấp cho bạn mua hoặc bán tín hiệu: Thời gian khuyến nghị: 5 phút
Đối với Long Entry:
- Kiểm tra xem giá có cao hơn EMA thiết lập (Có thể vô hiệu hóa quy tắc này nếu bạn muốn trong cài đặt)
- Chỉ số RSI ở mức bán quá mức
- ADX nằm trên ngưỡng
Trend Ready (có nghĩa là có xu hướng đang diễn ra) - Giá phải chấp thuận xu hướng của các nến trước đây. Đây là tăng cho các mục mua và giảm cho các mục bán.
- Nhập với stop loss dưới mức thấp cuối cùng với tỷ lệ lợi nhuận 1: 1 hoặc 1,5: 1.
Đối với bài viết ngắn:
- Kiểm tra xem giá dưới đường EMA được đặt (Có thể vô hiệu hóa quy tắc này nếu bạn muốn trong cài đặt)
- Chỉ số RSI ở mức mua quá mức
- ADX nằm trên ngưỡng
Trend Ready (có nghĩa là có xu hướng đang diễn ra) - Giá phải chấp thuận xu hướng của các nến trước đây. Đây là tăng cho các mục mua và giảm cho các mục bán.
- Nhập với stop loss trên mức cao cuối cùng với tỷ lệ lợi nhuận 1: 1 hoặc 1,5: 1.
Đây là chỉ số đầu tiên của tôi. Hãy cho tôi biết nếu bạn muốn bất kỳ cập nhật. Tôi không chắc chắn nếu tôi có thể thêm tất cả nhưng tôi sẽ cố gắng tuy nhiên.
Thay đổi: Các tín hiệu sẽ kiểm tra lên đến 2 nến trước khi RSI thấp hơn hoặc cao hơn giá trị đặt để hiển thị tín hiệu.
backtest
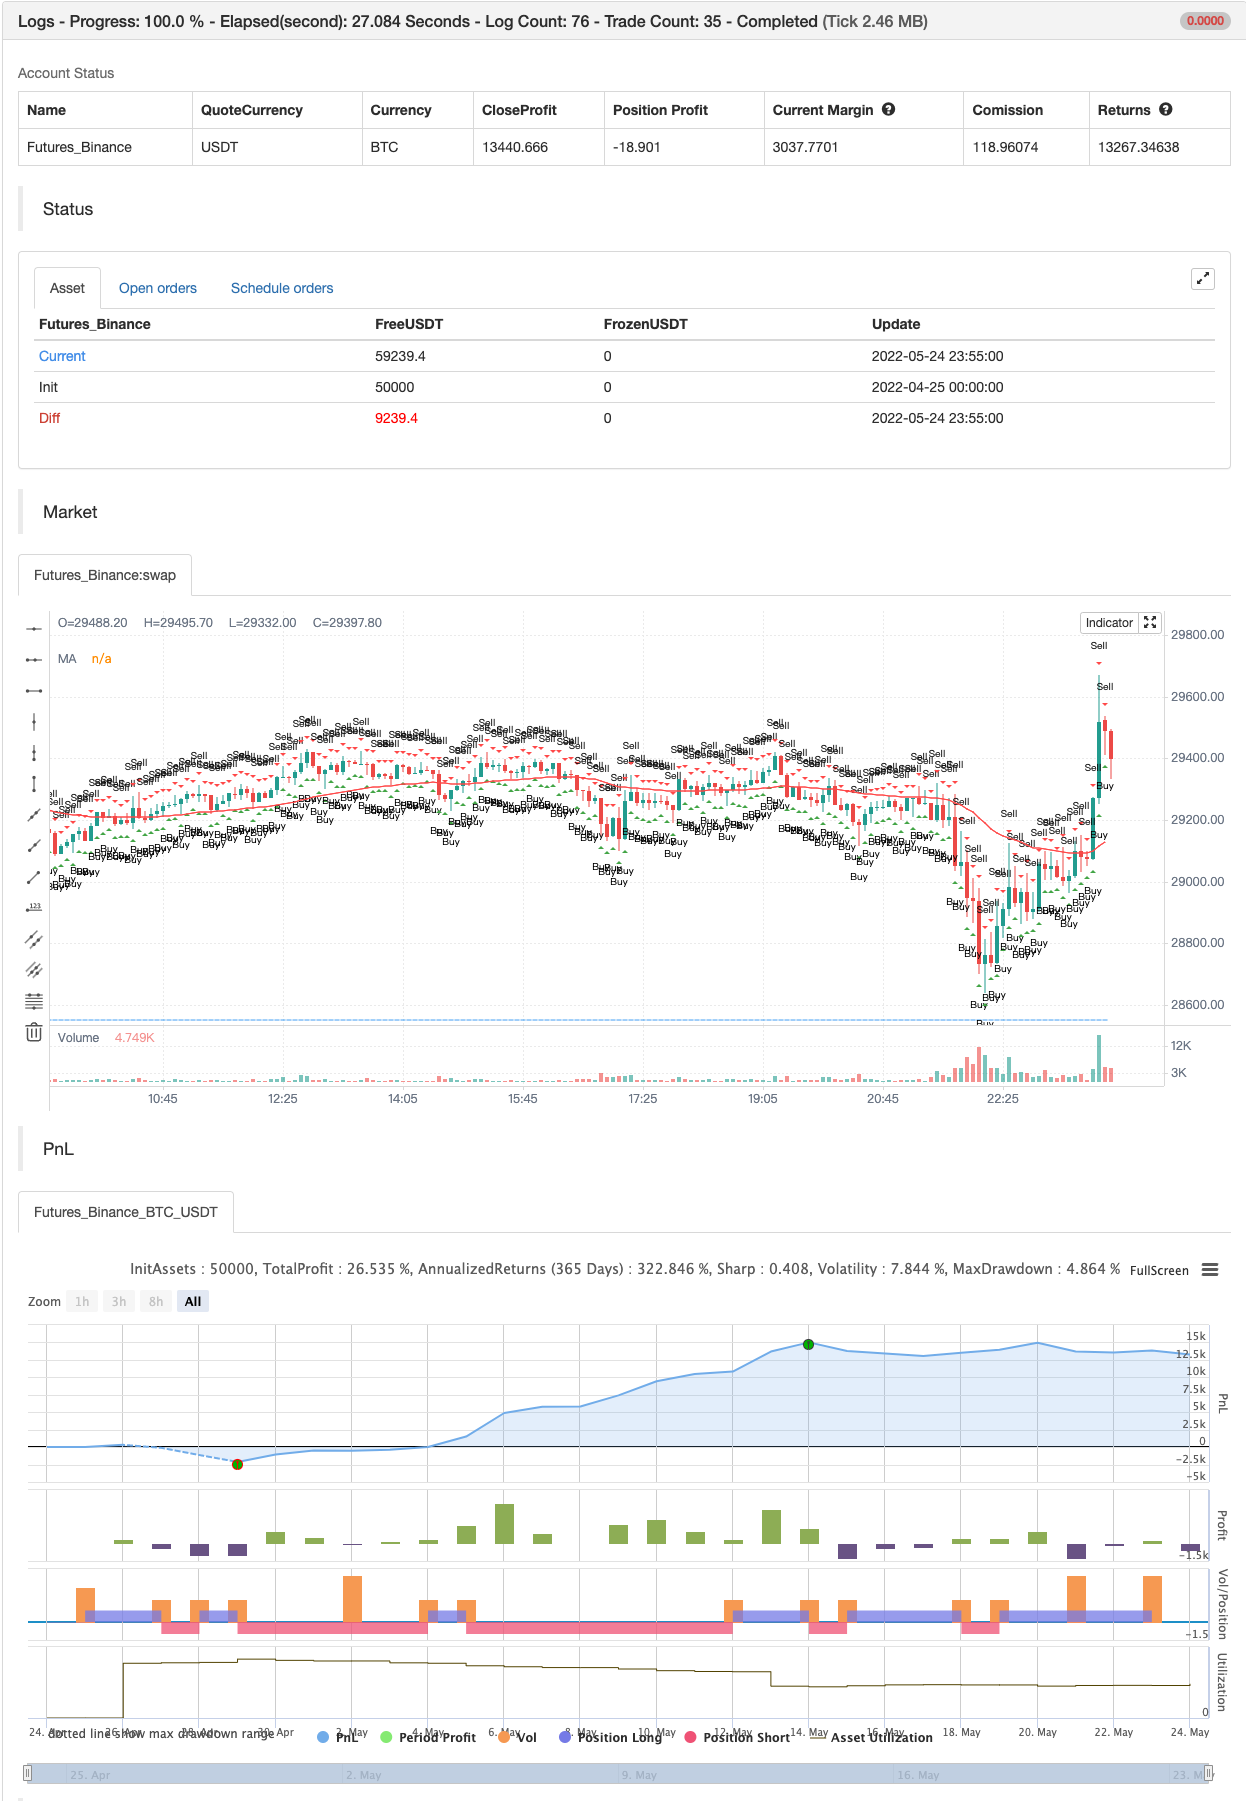
/*backtest
start: 2022-04-25 00:00:00
end: 2022-05-24 23:59:00
period: 5m
basePeriod: 1m
exchanges: [{"eid":"Futures_Binance","currency":"BTC_USDT"}]
*/

//@version=5
indicator(title='EMA RSI ADX Scalping Alerts', shorttitle="ERA Scalper", overlay=true)

//Define MA Inputs and group them
maType = input.string(title="MA Type", options=["EMA", "SMA", "WMA", "VWMA", "HMA", "RMA", "DEMA", "TEMA", "LSMA", "ZLSMA"], defval="EMA", group='MA Settings')
emaSource = input.source(title='MA Source', defval=close, group='MA Settings')
emaLength = input.int(title='MA Length', defval=50, minval=1, maxval=999, group='MA Settings')

//Other Moving Avarage Calculations
e1 = ta.ema(emaSource, emaLength)
e2 = ta.ema(e1, emaLength)
dema = 2 * e1 - e2

ema1 = ta.ema(emaSource, emaLength)
ema2 = ta.ema(ema1, emaLength)
ema3 = ta.ema(ema2, emaLength)
tema = 3 * (ema1 - ema2) + ema3

lsmaOffset = input.int(title="LSMA Offset", defval=0, minval=0, maxval=100, tooltip='Only used if you choose the LSMA and ZLSMA(Zero Lag LSMA) Option between MA Types', group='MA Settings')
lsma = ta.linreg(emaSource, emaLength, lsmaOffset)
lsma2 = ta.linreg(lsma, emaLength, lsmaOffset)
eq = lsma-lsma2
zlsma = lsma+eq

// Switch between different MA Types
emaValue = switch maType
    "EMA" => ta.ema(emaSource, emaLength)
    "SMA" => ta.sma(emaSource, emaLength)
    "WMA" => ta.wma(emaSource, emaLength)
    "VWMA" => ta.vwma(emaSource, emaLength)
    "HMA" => ta.hma(emaSource, emaLength)
    "RMA" => ta.rma(emaSource, emaLength)
    "DEMA" => dema
    "TEMA" => tema
    "LSMA" => lsma
    "ZLSMA" => zlsma
    =>
        runtime.error("No matching MA type found.")
        float(na)

//Define RSI inputs and group them
rsiSource = input.source(title='RSI Source', defval=close, group='RSI Settings')
rsiLength = input.int(title='RSI Length', defval=3, minval=0, maxval=100, group='RSI Settings')
rsiValuee = ta.rsi(rsiSource, rsiLength)
rsiOverbought = input.int(title='RSI Overbought Level', defval=80, group='RSI Settings')
rsiOversold = input.int(title='RSI Oversold Level', defval=20, group='RSI Settings')

//Define overbought and oversold conditions
isRsiOB = rsiValuee >= rsiOverbought
isRsiOS = rsiValuee <= rsiOversold

//ADX Inputs and calculation of the value
adxlen = input.int(5, title='ADX Smoothing', group='ADX Settings')
dilen = input.int(5, title='DI Length', group='ADX Settings')
dirmov(len) =>
    up = ta.change(high)
    down = -ta.change(low)
    plusDM = na(up) ? na : up > down and up > 0 ? up : 0
    minusDM = na(down) ? na : down > up and down > 0 ? down : 0
    truerange = ta.rma(ta.tr, len)
    plus = fixnan(100 * ta.rma(plusDM, len) / truerange)
    minus = fixnan(100 * ta.rma(minusDM, len) / truerange)
    [plus, minus]
adx(dilen, adxlen) =>
    [plus, minus] = dirmov(dilen)
    sum = plus + minus
    adx = 100 * ta.rma(math.abs(plus - minus) / (sum == 0 ? 1 : sum), adxlen)
    adx
sig = adx(dilen, adxlen)

//Define the input and value where it is considered that there is a trend going on
adxLimit = input.int(title='Trend Ready Limit', defval=30, minval=0, maxval=100, group='ADX Settings')
trendReady = sig > adxLimit

//Draw trend ready at the bottom of the chart for better viewing so that you can change the value based on what you see easier
plotADX = input(title='Draw Trend Ready On Chart', defval=false)
readyFold = plotADX and sig > adxLimit
plotchar(series=readyFold, title='Trend Ready', location=location.bottom, color=color.new(color.blue, 0), size=size.small, char='_')

//Plot the EMA on chart
enableEmaRule = input(title='Enable MA Rule', defval=true)

//Define the signal conditions and choice to add or leave out MA Rule if you wish so
alertLong = enableEmaRule ? low > emaValue and (rsiValuee <= rsiOversold or rsiValuee[1] <= rsiOversold or rsiValuee[2] <= rsiOversold) and sig > adxLimit and close > high[1] : (rsiValuee <= rsiOversold or rsiValuee[1] <= rsiOversold or rsiValuee[2] <= rsiOversold) and sig > adxLimit and close > high[1]
alertShort = enableEmaRule ? high < emaValue and (rsiValuee >= rsiOverbought or rsiValuee[1] >= rsiOverbought or rsiValuee[2] >= rsiOverbought) and sig > adxLimit and close < low[1] : (rsiValuee >= rsiOverbought or rsiValuee[1] >= rsiOverbought or rsiValuee[2] >= rsiOverbought) and sig > adxLimit and close < low[1]
plot(enableEmaRule ? emaValue : na, color=color.new(color.red, 0), title='MA')

//Buy and Sell Shapes on Chart
plotshape(alertLong, title='Buy', location=location.belowbar, color=color.new(color.green, 0), size=size.small, style=shape.triangleup, text='Buy')
plotshape(alertShort, title='Sell', location=location.abovebar, color=color.new(color.red, 0), size=size.small, style=shape.triangledown, text='Sell')

//Alerts
alertcondition(title='Buy Alert', condition=alertLong, message='Long Conditions are Met')
alertcondition(title='Sell Alert', condition=alertShort, message='Short Conditions are Met')
alertcondition(title='Buy / Sell Alert', condition=alertLong or alertShort, message='Conditions Met for Buy or Short')

if alertLong
    strategy.entry("Enter Long", strategy.long)
else if alertShort
    strategy.entry("Enter Short", strategy.short)
- Super Scalper - 5 phút 15 phút
- VWMA-ADX Momentum và Chiến lược dài Bitcoin dựa trên xu hướng
- Rainbow Oscillator
- SuperJump quay lại Bollinger Band
- ESSMA
- Super Scalper
- MACD thông minh hơn
- ZigZag dựa trên động lượng
- Chiến lược DCA động dựa trên khối lượng
- Lý thuyết sóng Elliott 4-9 Sóng xung phát hiện tự động Chiến lược giao dịch
- SAR cao thấp
- SuperTREX
- Máy phát hiện đỉnh
- Tìm thấp
- Xu hướng SMA
- Bollinger Lows
- siêu xu hướng B
- SIGNAL TRADING SWING
- Chu kỳ xu hướng Schaff
- 72s: Đường trung bình chuyển động thân xe thích nghi +
- Sự khác biệt về khối lượng
- Super Trend Daily 2.0 BF
- Hull Moving Average Swing Trader
- FTSMA - Trend là bạn của bạn
- Range Filter Mua và bán
- Kênh SSL
- Chiến lược Hull Suite
- SAR Parabolic Mua và bán
- Tiêu chí tối đa và tối thiểu dựa trên pivot
- Nick Rypock Lái ngược (NRTR)