Chỉ số thiết lập Demark
Tác giả:ChaoZhang, Ngày: 2022-05-31 19:29:50Tags:tăng giágiảm
Chỉ số thiết lập được tạo ra bởi Tom Demark và đây là một trong nhiều bước trong chỉ số thứ tự của anh ta mà tôi sẽ công bố vào một ngày sau đó. Các bạn dường như rất thích kịch bản điểm đảo ngược Demark của tôi và chỉ số này rất giống với chỉ số đó. Chỉ số này được thiết kế cho các bước đảo ngược xu hướng nhỏ và như bạn có thể thấy trong biểu đồ ví dụ của tôi, nó cung cấp nhiều tín hiệu mua và bán hơn. Tất nhiên không phải tất cả đều hoàn hảo nhưng nó làm một công việc khá tốt trong việc xác định các bước đảo ngược giá nhỏ nói chung. Chỉ số này tìm kiếm xu hướng giảm hoặc xu hướng tăng tồn tại trong một khoảng thời gian nhất định để xác định các điểm đảo ngược giá.
Nếu bạn thích điều này, hãy cho tôi biết và tôi sẽ tiếp tục xuất bản thêm các chỉ số Demark hoặc ít nhất là phiên bản của tôi.
backtest
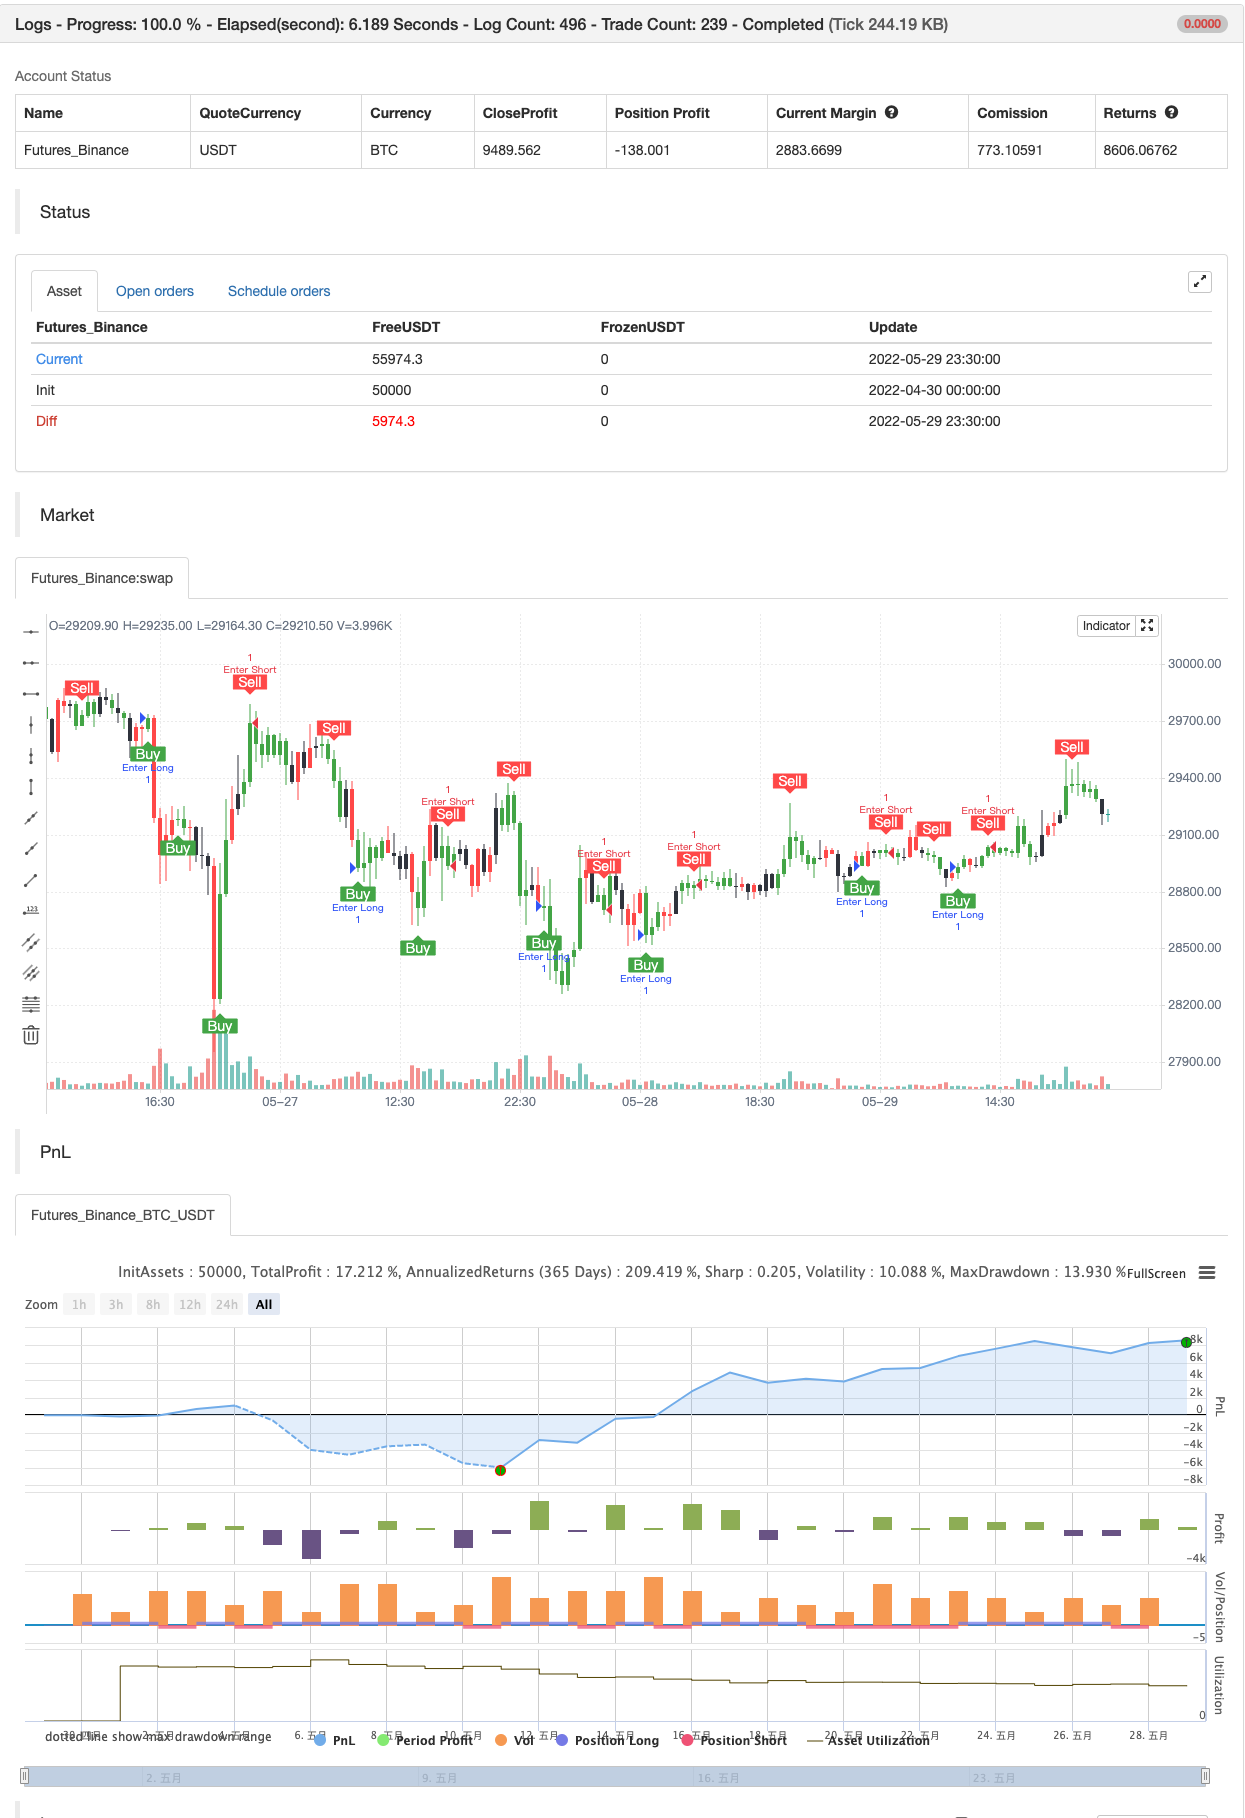
/*backtest
start: 2022-04-30 00:00:00
end: 2022-05-29 23:59:00
period: 30m
basePeriod: 15m
exchanges: [{"eid":"Futures_Binance","currency":"BTC_USDT"}]
*/

//@version=4
// Copyright (c) 2019-present, Franklin Moormann (cheatcountry)
// Demark Setup Indicator [CC] script may be freely distributed under the MIT license.
study("Demark Setup Indicator [CC]", overlay=true)

inp = input(title="Source", type=input.source, defval=close)
res = input(title="Resolution", type=input.resolution, defval="")
rep = input(title="Allow Repainting?", type=input.bool, defval=false)
bar = input(title="Allow Bar Color Change?", type=input.bool, defval=true)
src = security(syminfo.tickerid, res, inp[rep ? 0 : barstate.isrealtime ? 1 : 0])[rep ? 0 : barstate.isrealtime ? 0 : 1]
length = input(title="Length", type=input.integer, defval=4, minval=1)

uCount = 0, dCount = 0
for i = 0 to length - 1
    uCount := uCount + (nz(src[i]) > nz(src[i + length]) ? 1 : 0)
    dCount := dCount + (nz(src[i]) < nz(src[i + length]) ? 1 : 0)

dsi = dCount == length ? 1 : uCount == length ? -1 : 0

sig = dsi > 0 or uCount > dCount ? 1 : dsi < 0 or dCount > uCount ? -1 : 0
dsiColor = sig > 0 ? color.green : sig < 0 ? color.red : color.black
alertcondition(crossover(dsi, 0), "Buy Signal", "Bullish Change Detected")
alertcondition(crossunder(dsi, 0), "Sell Signal", "Bearish Change Detected")
barcolor(bar ? dsiColor : na)
plotshape(crossover(dsi, 0), "Buy", shape.labelup, location.belowbar, color.green, text="Buy", textcolor=color.white)
plotshape(crossunder(dsi, 0), "Sell", shape.labeldown, location.abovebar, color=color.red, text="Sell", textcolor=color.white)


if crossover(dsi, 0)
    strategy.entry("Enter Long", strategy.long)
else if crossunder(dsi, 0)
    strategy.entry("Enter Short", strategy.short)
- Phân đoạn bị phá vỡ: giấc mơ bị phá vỡ của ai đó là lợi nhuận của bạn!
- ZigZag PA Chiến lược V4.1
- Swing Highs / Lows & Mô hình nến
- Nến tràn ngập
- Sự phá vỡ hỗ trợ-kháng cự
- MTF RSI & Chiến lược STOCH
- jma + dwma bằng nhiều hạt
- Đường trung bình chuyển động màu EMA/SMA
- giao dịch nhiều khung thời gian
- RSI của zdmre
- Số lượng gạch (Renko)
- Range Filter Mua và bán 5 phút [Chiến lược]
- Đòn búa đảo ngược - Tùy chọn mở rộng
- TUE ADX/MACD Confluence V1.0
- Bộ lọc phạm vi đôi
- SAR - cao và thấp
- Hệ thống giao dịch swing chính xác
- Xu hướng tuyến tính
- Mô hình thời gian Fibonacci
- Darvas Box mua bán
- Bollinger Bands Stochastic RSI cực
- Chỉ số AK MACD BB V 1.00
- SAR Parabolic
- Chỉ số RSI Divergence
- Chỉ số OBV MACD
- Xu hướng chuyển động
- Chiến lược chênh lệch giá v1.0
- Sự phá vỡ hỗ trợ-kháng cự
- Đường trung bình động thích nghi độ dốc
- Chiến lược dao động Delta-RSI