
Overview
This strategy is a trend-following trading system based on the Average True Range (ATR) indicator, which identifies market trends through dynamic calculation of price volatility ranges and incorporates adaptive take-profit and stop-loss mechanisms for risk management. The strategy employs a multi-period analysis approach, using ATR multiplier to dynamically adjust trade signal triggers for precise market volatility tracking.
Strategy Principles
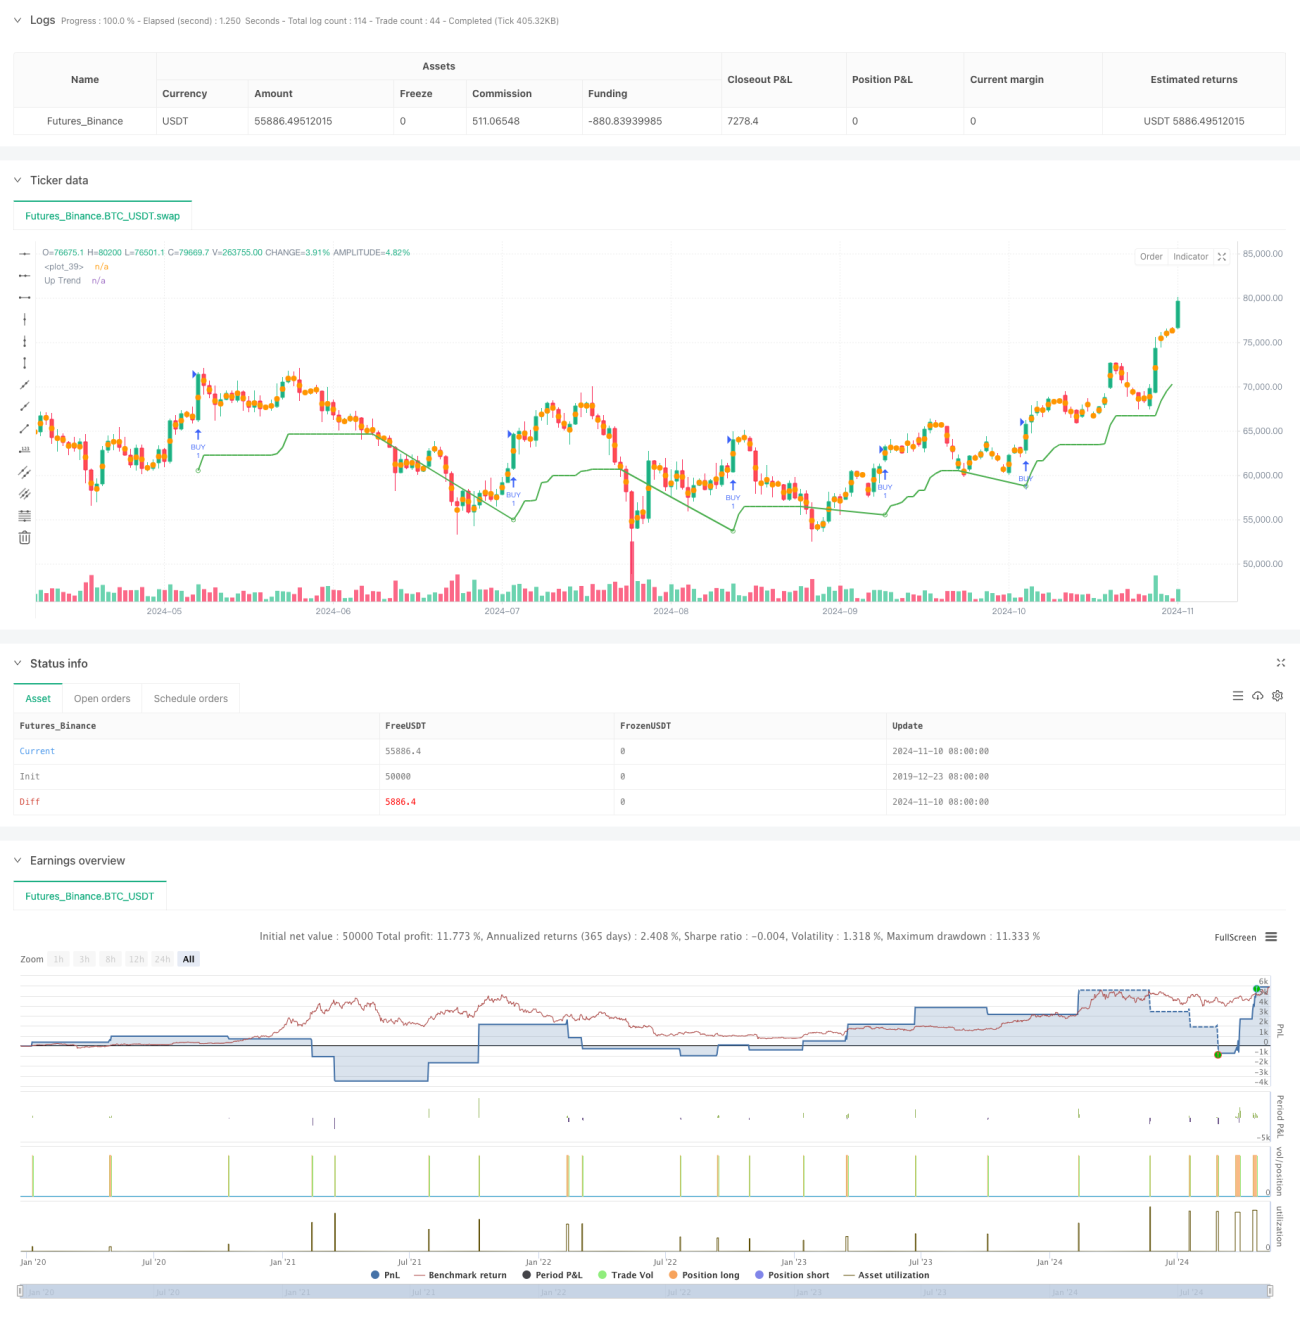
The core strategy is based on dynamic ATR calculations, using a period parameter (default 10) to compute market true range. An ATR multiplier (default 3.0) is used to construct upper and lower channels, triggering trading signals when price breaks through these channels. Specifically:
- Uses SMA or standard ATR for volatility baseline calculation
- Dynamically computes upper and lower channels as trend-following references
- Determines trend direction through price and channel crossovers
- Triggers trading signals at trend reversal points
- Implements percentage-based dynamic take-profit and stop-loss system
Strategy Advantages
- High Adaptability: Dynamically adjusts to market volatility through ATR
- Controlled Risk: Built-in percentage-based take-profit and stop-loss mechanisms effectively control per-trade risk
- Parameter Flexibility: Key parameters like ATR period and multiplier can be adjusted based on market characteristics
- Visual Clarity: Provides comprehensive graphical interface including trend markers and signal alerts
- Time Management: Supports custom trading time windows, improving strategy applicability
Strategy Risks
- Trend Reversal Risk: May generate frequent false signals in ranging markets
- Parameter Sensitivity: Choice of ATR period and multiplier significantly impacts strategy performance
- Market Environment Dependency: May experience larger slippage during high volatility periods
- Stop Loss Settings: Fixed percentage stops may not suit all market conditions
Strategy Optimization Directions
- Introduce multiple timeframe analysis to improve trend identification accuracy
- Add volume indicator confirmation to enhance signal reliability
- Develop adaptive take-profit and stop-loss mechanisms that adjust dynamically with market volatility
- Include trend strength filters to reduce false signals
- Integrate volatility indicators to optimize entry timing
Summary
This is a well-designed trend-following strategy that achieves precise market volatility tracking through the ATR indicator, combined with take-profit and stop-loss mechanisms for risk management. The strategy's strengths lie in its adaptability and controlled risk, though market environment impact on strategy performance should be noted. Through the suggested optimization directions, the strategy's stability and profitability can be further enhanced.
- 1