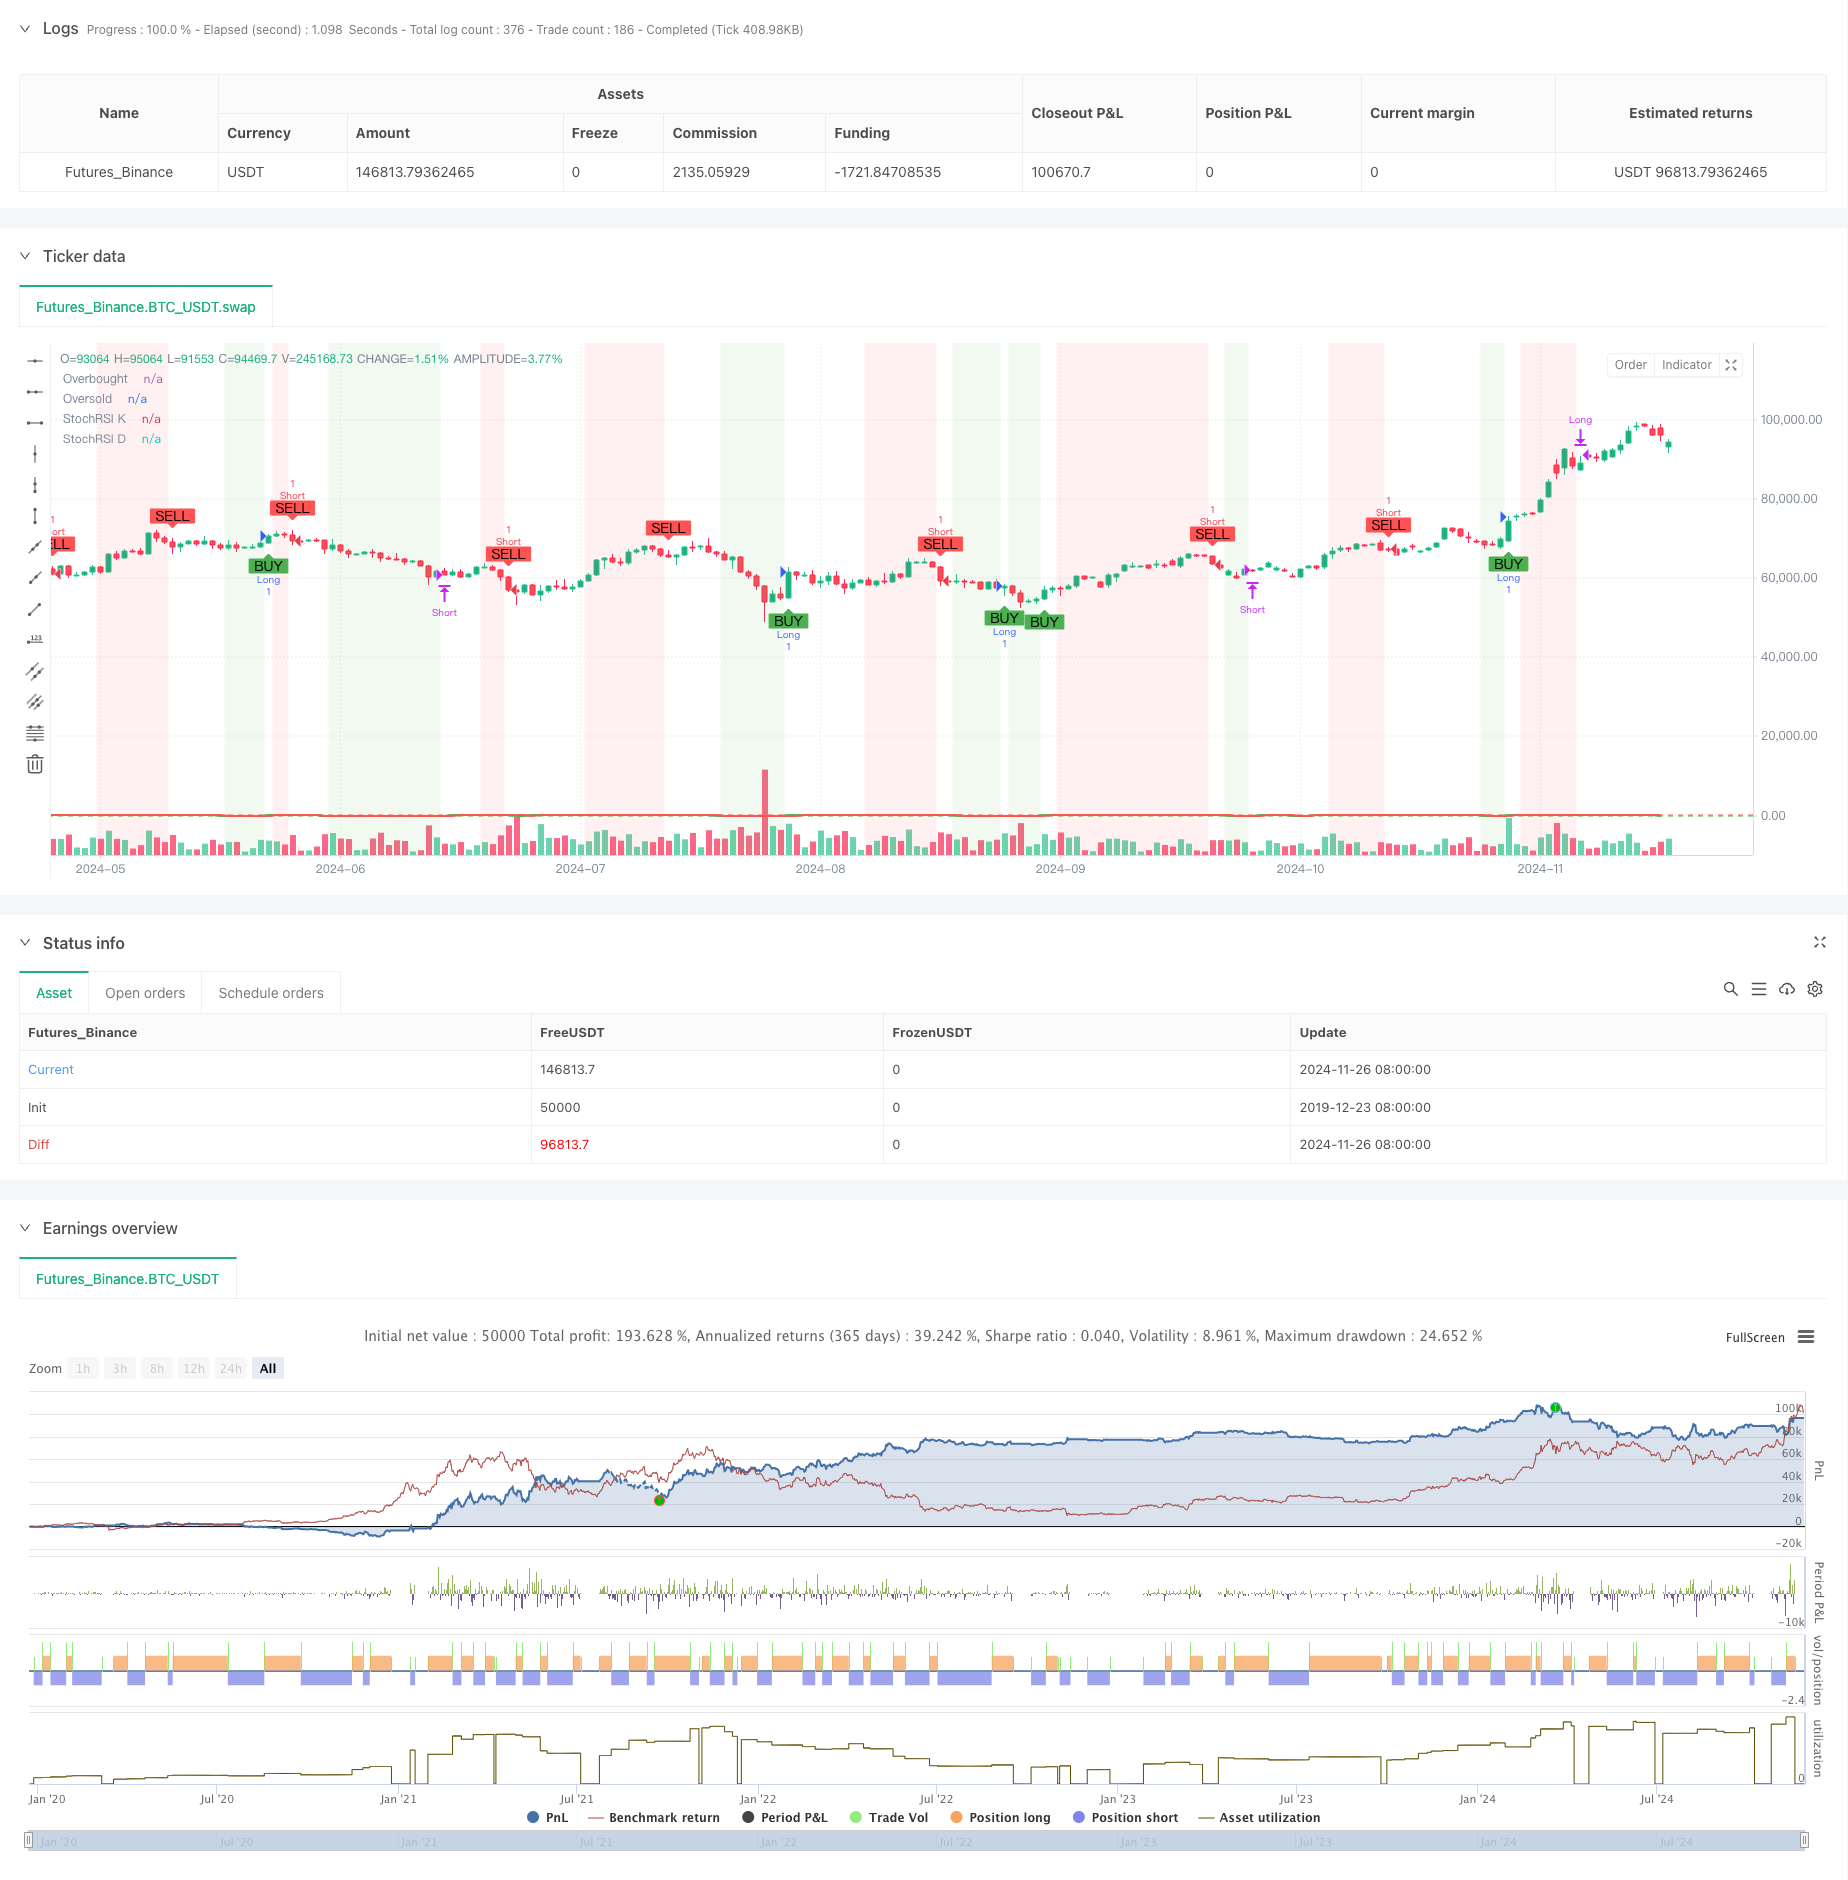
概述
该策略是一个结合了随机相对强弱指数(Stochastic RSI)和蜡烛图形态的复合型交易系统。系统通过分析SRSI指标的超买超卖水平,配合价格走势的蜡烛图确认,实现全自动化的交易信号生成。策略采用了先进的技术指标组合方法,融合了趋势跟踪和反转交易的特点,具有较强的市场适应性。
策略原理
策略的核心逻辑建立在以下几个关键要素之上: 1. 使用14周期的RSI作为基础,计算随机RSI值,形成主要的信号来源 2. 将随机RSI的K线和D线设置为3周期的简单移动平均,用于平滑信号 3. 设定80和20作为超买超卖的临界值,用于判断市场状态 4. 结合当前蜡烛图的开盘价和收盘价关系,确认市场走势方向 5. 当K线向上穿越超卖水平且出现阳线时,触发做多信号 6. 当K线向下穿越超买水平且出现阴线时,触发做空信号 7. 分别在K线穿越超买超卖水平时实现对应方向的止损
策略优势
- 信号可靠性高:通过随机RSI和蜡烛图双重确认机制,显著提高了交易信号的准确性
- 风险控制完善:设置了明确的止损条件,可以有效控制每笔交易的风险
- 参数可调节性强:关键参数都可以根据不同市场特征进行优化调整
- 视觉反馈清晰:使用背景颜色和图形标记,直观显示交易信号
- 自动化程度高:从信号生成到订单执行全程自动化,减少人为干预
策略风险
- 震荡市场风险:在横盘震荡市场可能产生频繁的假突破信号
- 滞后性风险:移动平均线的计算具有一定滞后性,可能错过最佳入场点
- 参数敏感性:不同参数设置会显著影响策略表现,需要持续优化
- 市场环境依赖:在剧烈波动的市场环境下,信号可能不够稳定
- 系统性风险:当市场出现重大事件时,止损设置可能失效
策略优化方向
- 引入成交量指标:可以增加成交量作为信号确认的附加条件
- 优化止损机制:可以考虑使用跟踪止损或ATR动态止损
- 增加趋势过滤:添加长周期移动平均线作为趋势过滤器
- 完善信号过滤:考虑市场波动率,在高波动率时调整参数
- 动态参数调整:根据市场状态动态调整超买超卖阈值
总结
该策略通过结合随机RSI指标和蜡烛图形态,构建了一个稳健的交易系统。系统在保持操作简单的同时,实现了较好的风险控制。通过合理的参数优化和信号过滤,策略能够适应不同的市场环境。建议交易者在实盘使用前,进行充分的历史数据回测,并根据具体市场特征调整参数设置。
策略源码
/*backtest
start: 2019-12-23 08:00:00
end: 2024-11-27 08:00:00
period: 1d
basePeriod: 1d
exchanges: [{"eid":"Futures_Binance","currency":"BTC_USDT"}]
*/

//@version=5
strategy("Stochastic RSI Strategy with Candlestick Confirmation", overlay=true)

// Input parameters for Stochastic RSI
rsiPeriod = input.int(14, title="RSI Period")
stochRsiPeriod = input.int(14, title="Stochastic RSI Period")
kPeriod = input.int(3, title="K Period")
dPeriod = input.int(3, title="D Period")

// Overbought and Oversold levels
overboughtLevel = input.int(80, title="Overbought Level", minval=50, maxval=100)
oversoldLevel = input.int(20, title="Oversold Level", minval=0, maxval=50)

// Calculate RSI
rsi = ta.rsi(close, rsiPeriod)

// Calculate Stochastic RSI
stochRSI = ta.stoch(rsi, rsi, rsi, stochRsiPeriod)  // Stochastic RSI calculation using the RSI values

// Apply smoothing to StochRSI K and D lines
k = ta.sma(stochRSI, kPeriod)
d = ta.sma(k, dPeriod)

// Plot Stochastic RSI on separate panel
plot(k, title="StochRSI K", color=color.green, linewidth=2)
plot(d, title="StochRSI D", color=color.red, linewidth=2)
hline(overboughtLevel, "Overbought", color=color.red, linestyle=hline.style_dashed)
hline(oversoldLevel, "Oversold", color=color.green, linestyle=hline.style_dashed)

// Buy and Sell Signals based on both Stochastic RSI and Candlestick patterns
buySignal = ta.crossover(k, oversoldLevel) and close > open  // Buy when K crosses above oversold level and close > open (bullish candle)
sellSignal = ta.crossunder(k, overboughtLevel) and close < open  // Sell when K crosses below overbought level and close < open (bearish candle)

// Plot Buy/Sell signals as shapes on the chart
plotshape(series=buySignal, title="Buy Signal", location=location.belowbar, color=color.green, style=shape.labelup, text="BUY", size=size.small)
plotshape(series=sellSignal, title="Sell Signal", location=location.abovebar, color=color.red, style=shape.labeldown, text="SELL", size=size.small)

// Background color shading for overbought/oversold conditions
bgcolor(k > overboughtLevel ? color.new(color.red, 90) : na)
bgcolor(k < oversoldLevel ? color.new(color.green, 90) : na)

// Place actual orders with Stochastic RSI + candlestick pattern confirmation
if (buySignal)
    strategy.entry("Long", strategy.long)

if (sellSignal)
    strategy.entry("Short", strategy.short)

// Optionally, you can add exit conditions for closing long/short positions
// Close long if K crosses above the overbought level
if (ta.crossunder(k, overboughtLevel))
    strategy.close("Long")

// Close short if K crosses below the oversold level
if (ta.crossover(k, oversoldLevel))
    strategy.close("Short")
相关推荐